
The On-Demand Report Generator
Navigate to Reports to generate comprehensive production summaries: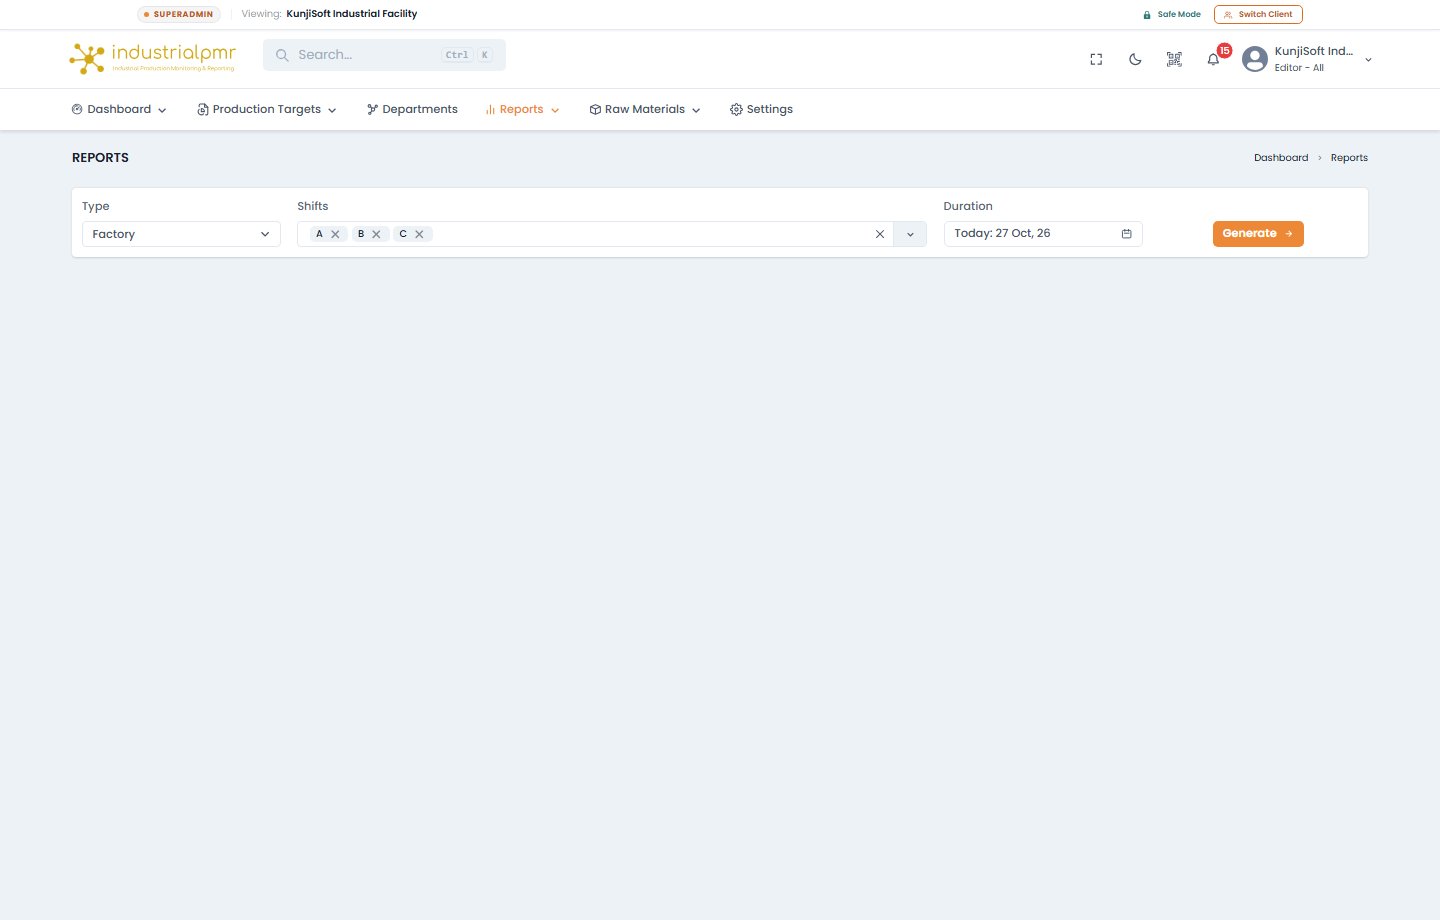
Report Configuration Parameters
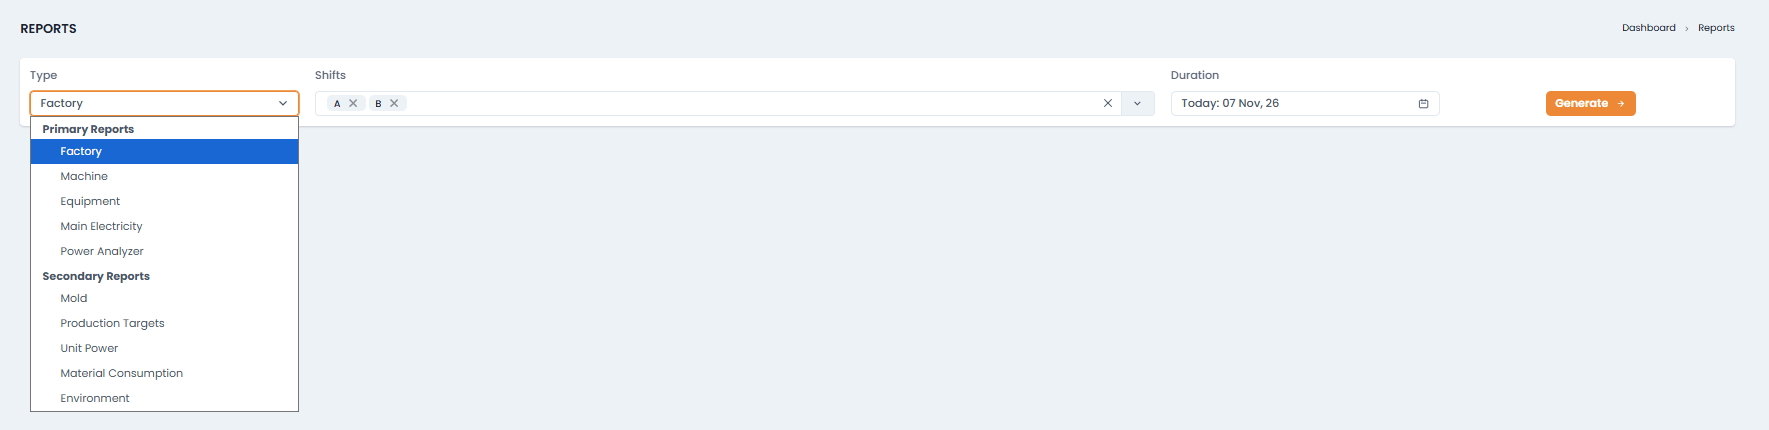
- Report Type:
- Factory Report: Complete factory floor summary encompassing all machines, departments, and total kWh.
- Machine Report: Deep single-machine telemetry log, cycle time distributions, and run/idle/off breakdowns.
- Equipment Report: Auxiliary machinery runtime, loading ratios, and energy usage.
- Main Electricity Report: 3-Phase substation demand profiles, power factor, and peak load trends.
- Unit Power Report: High-resolution electrical analysis for individual machine motors and heater banks.
- Environment Report: Ambient temperature and humidity tracking logs for cleanrooms and storage.
- Material Report: Resin consumption, regrind usage, and runner waste audit.
- Mold / Tooling Report: Tool stroke counts, mold life tracking, and maintenance due forecasts.
- Production Target Report: Quota fulfillment, scrap piece counts, and OEE scoring across active jobs.
- Shift Filter: Select individual shifts (
Shift A,Shift B,Shift C) or select all shifts to evaluate a full 24-hour cycle. - Duration: Choose predefined ranges (Today, Yesterday, This Week, Last 30 Days) or specify custom calendar start and end dates.
- Click Generate -> to compile the live report.
Interactive Report Viewer & Export
Once compiled, the Report Viewer renders interactive data tables and analytics: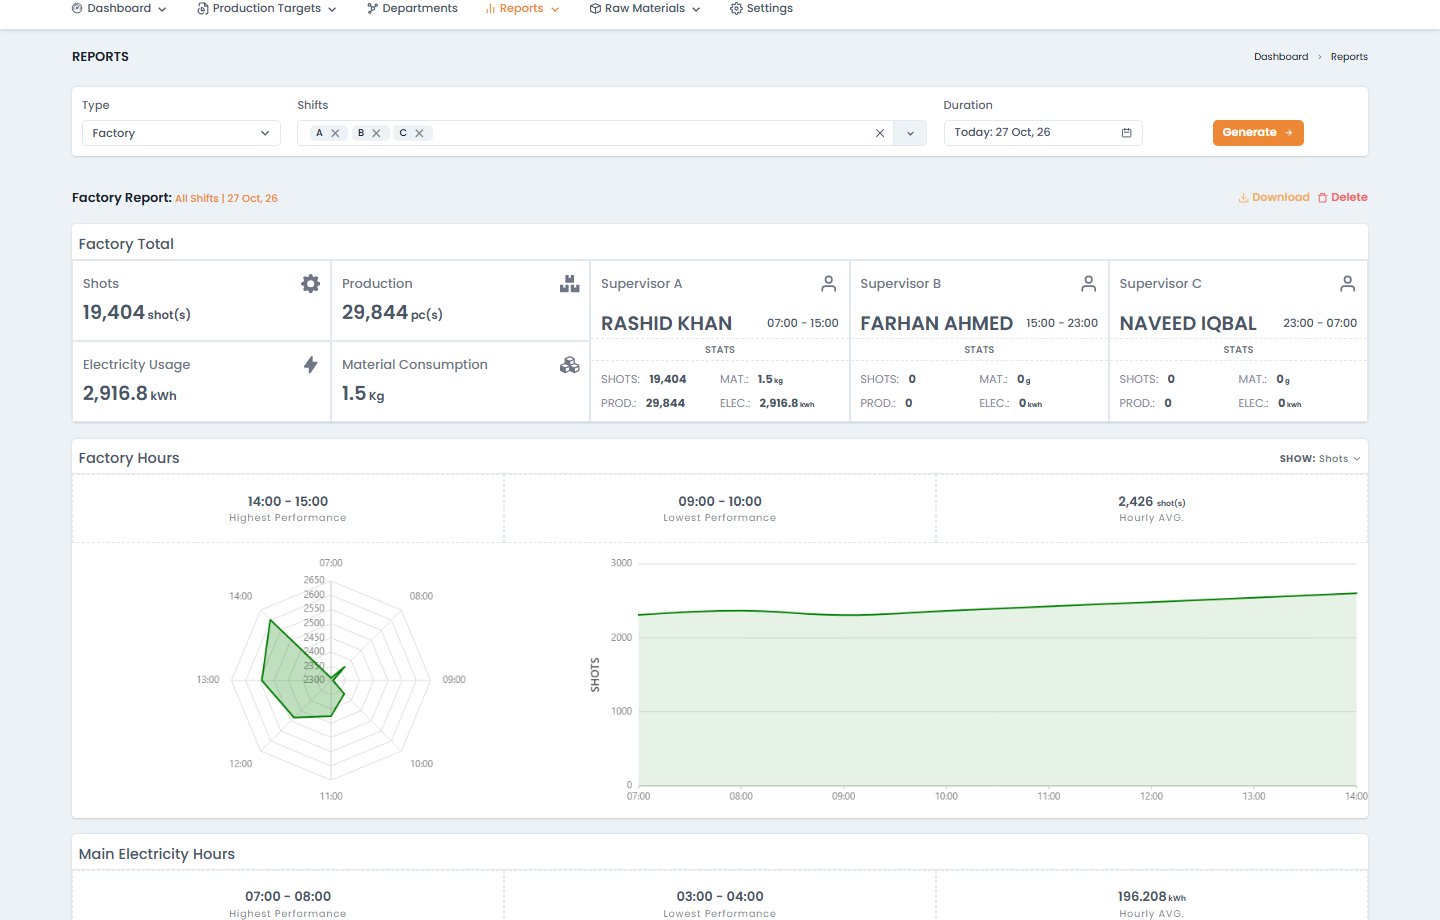
Shift Supervisor Breakdown
Multi-shift reports segment total factory output, machine cycles, power consumption, and raw material usage by supervisor:
Export Options
- Download as PDF: Generates executive-ready vectorized PDF summaries formatted with company headers, shift sign-offs, and KPI scorecards.
- Download as Excel (XLSX): Exports raw structured spreadsheets suitable for corporate finance, ERP importing, or custom pivot table analysis.
Report Types
Shareable Links
The report address carries the type, date_from, date_to, and option, so a report link can be shared or bookmarked. Links for Factory, Machine, Equipment, and Power Analyzer reports reopen automatically.Additional Export Formats
Reports can be downloaded as landscape PDF, Excel, or CSV. CSV is offered on tables such as the hourly details and the power analyzer tables.Factory Report
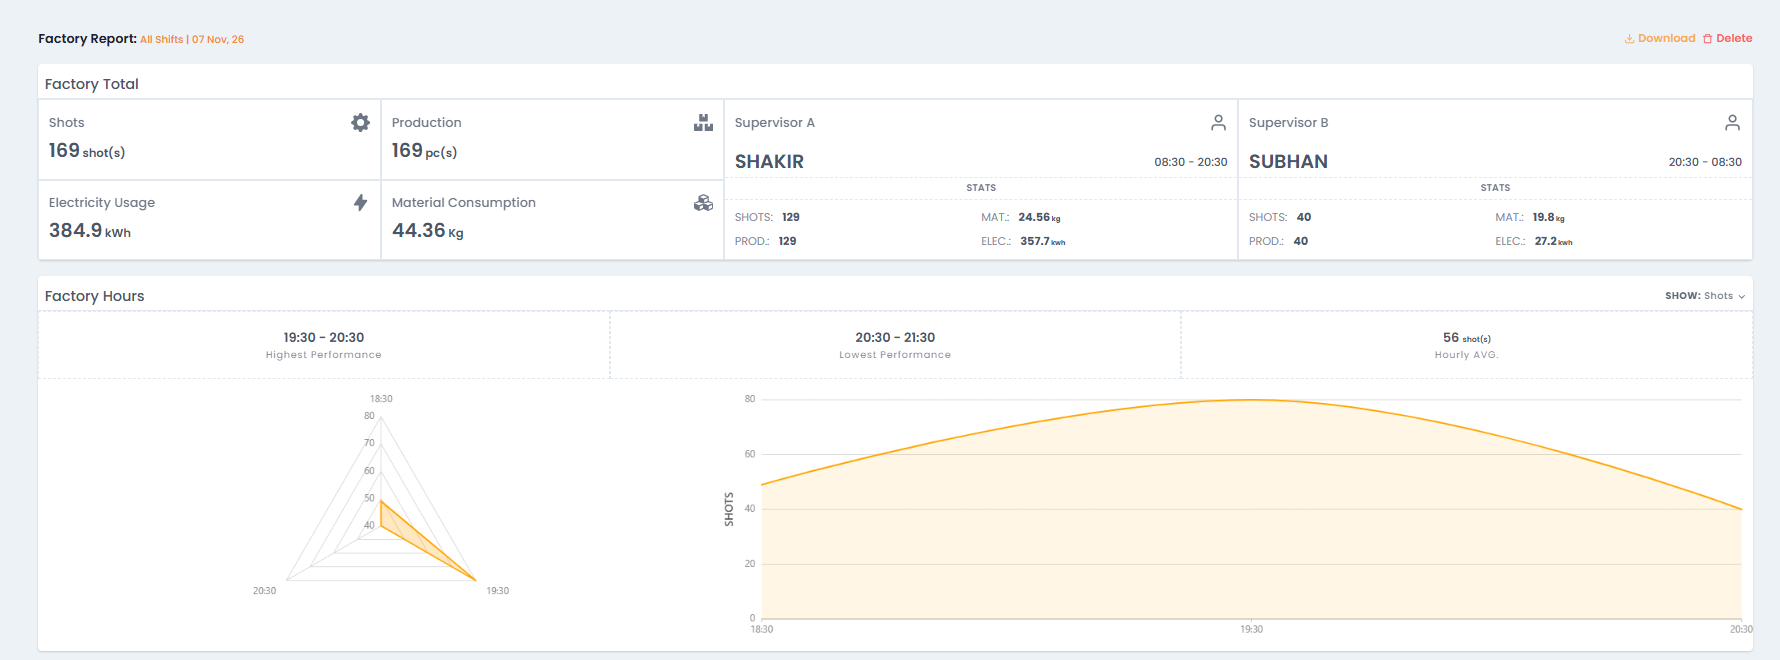
- The Machines table’s Downtime column links to that machine’s report for the same dates. The link also appears for a single-day report, not only a date range.
- Machine efficiency excludes planned downtime. Planned idle and off time are subtracted, limited to the machine’s recorded idle and off time and to the selected shifts.
Machine Report: Downtime
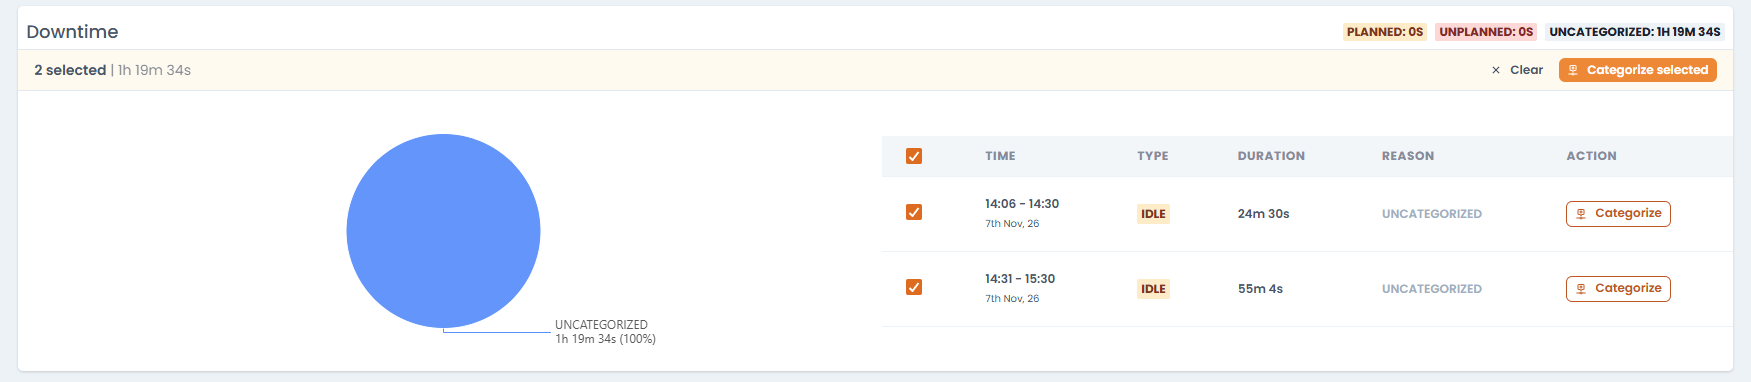
- A pie chart of downtime by category, and a table with Time, Type, Duration, Reason, and Action.
- The summary splits downtime into Planned, Unplanned, and Uncategorized.
- Categorize stops one by one or in bulk. See Downtime Categorization.
- The single-day Hourly details table includes the Downtime Reason column, as on the machine page.
- Efficiency excludes planned downtime.
Rejected Pieces
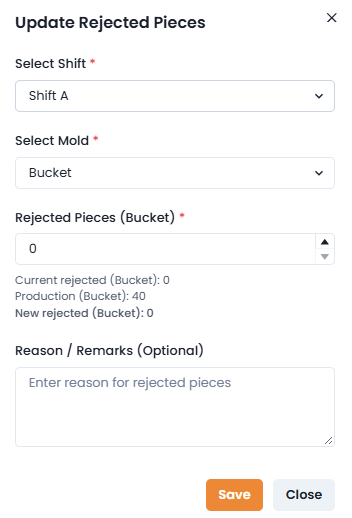
- Pick the shift.
- Pick the mold.
- Enter the rejected pieces and an optional reason.
Production Targets Report
- The hourly table has a Reason column showing the category (with a Planned badge). It shows UNCATEGORIZED for hours with downtime but no category, and
-otherwise. - Efficiency is the per-hour figure that excludes planned downtime.
- A downtime section lists the target’s stoppages.
Power Analyzer Report
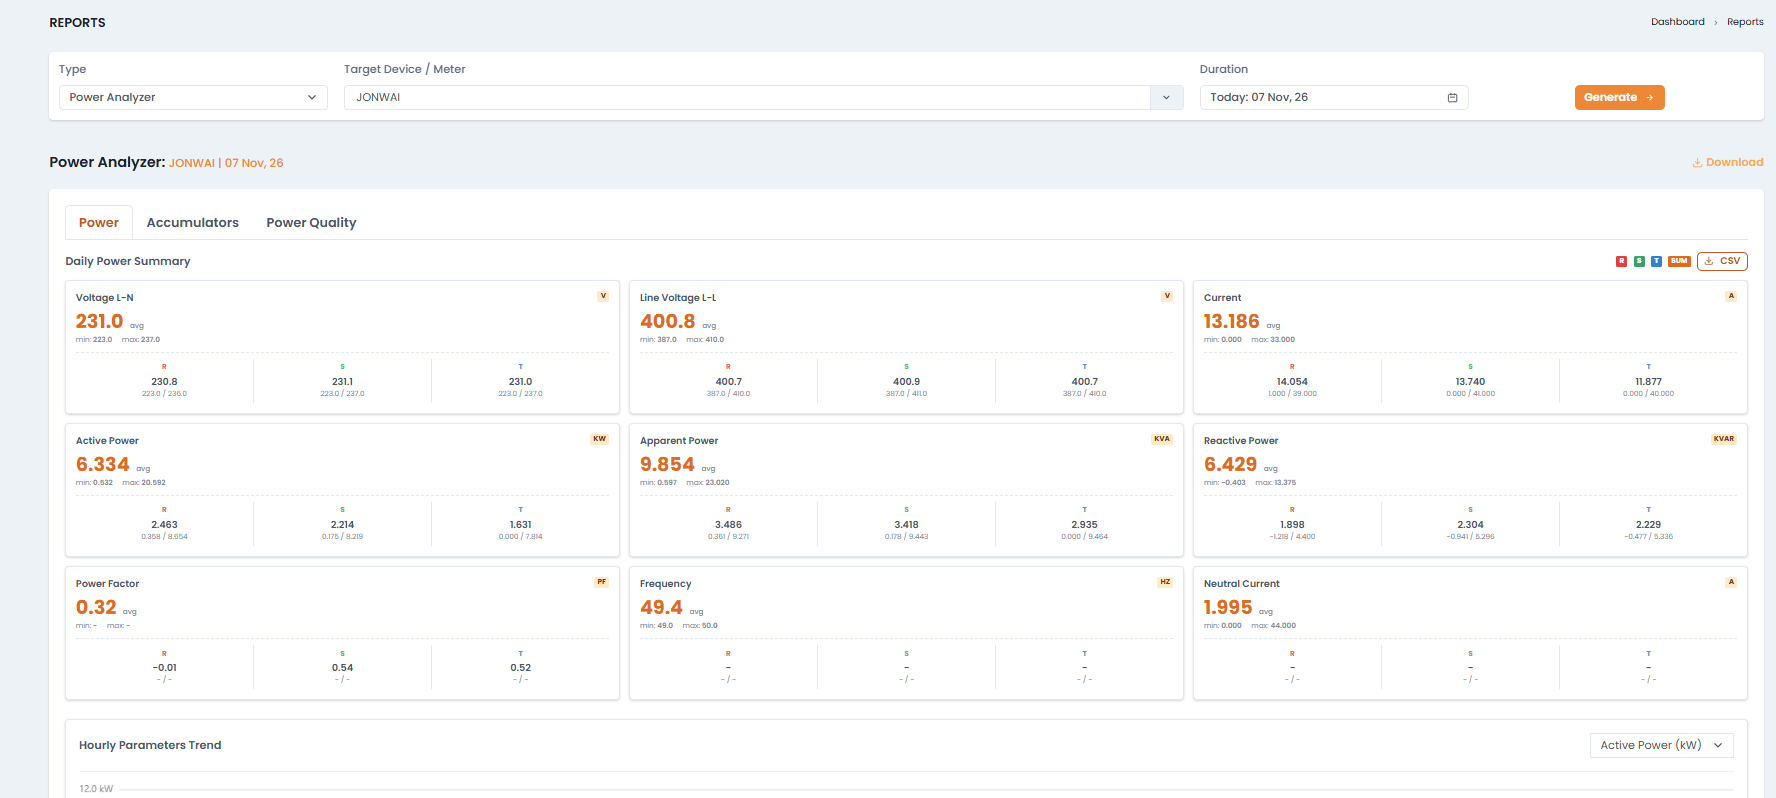
The report also includes a phase summary table (SUM, R, S, T with min, average, and maximum) and an hourly breakdown per phase.
Power Quality Tab Details
Power Quality Status Assessment rates the device from the day’s averages:
Worst Phase is the phase with the highest combined voltage and current THD.
System Audits & Efficiency Metrics adds four gauges, each with a status label:
Use View Details for to open the Daily Harmonics Summary or Hourly Harmonics Details tables, which list average and maximum voltage THD and current THD.
Universal Mold Report
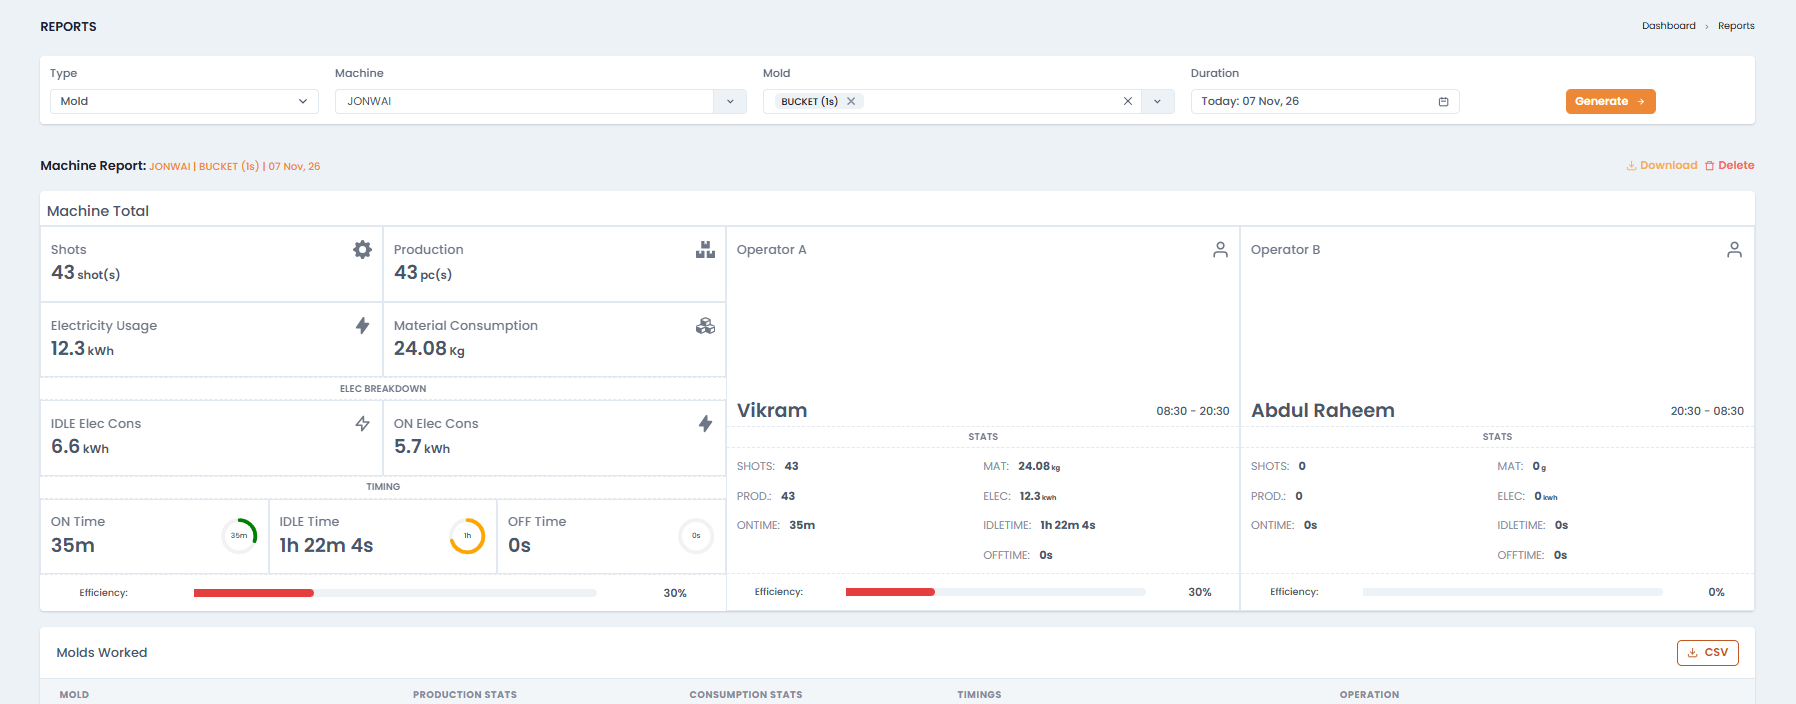
- A shift table: shift, timing, operator, shots, production, material, electricity, and times
- A mold table: average cycle time and the same measures
- An hours table for a single day, or a date table for a range
Report Options by Type
Main Electricity Report
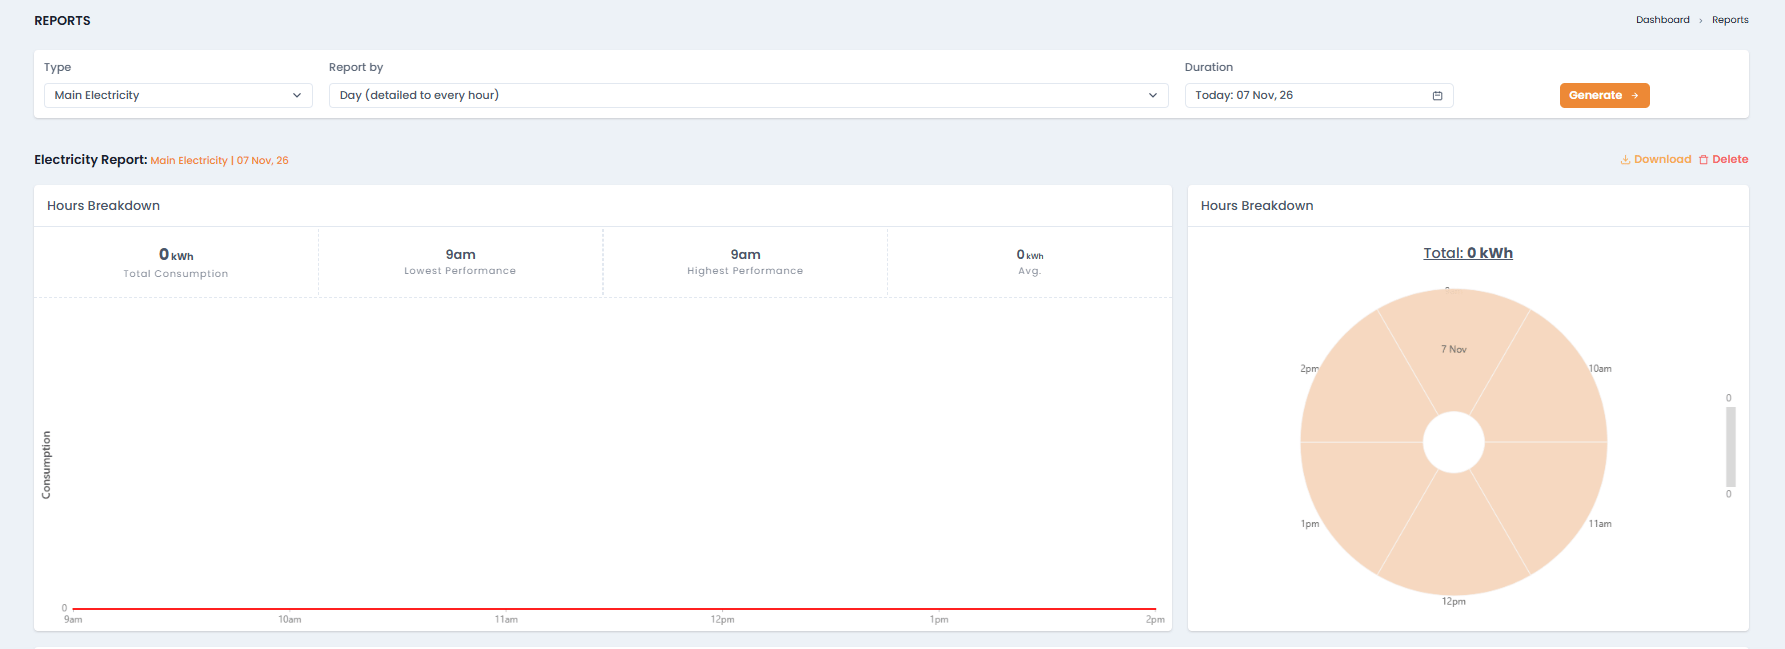
The report shows total consumption, the highest and lowest performance, and the highest and lowest consumer, with breakdown tables for hours, days, months, or years depending on the level you chose.
Material Consumption Report
Shows Total Consumption, Highest Consumption, Lowest Consumption, and Daily Average (the most and least consumed day), with a Breakdown of consumption (in kg) by machine or material.Unit Power Report
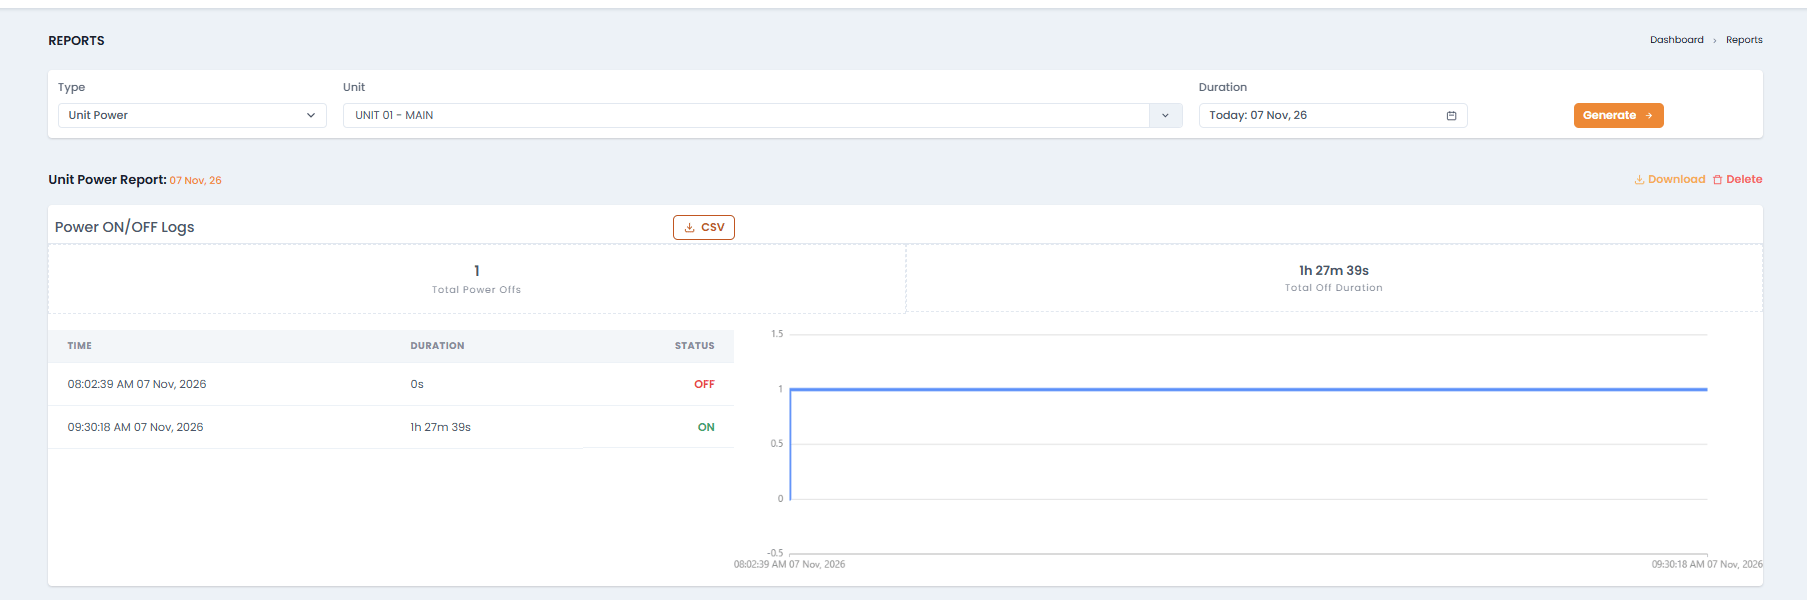
Environment Report
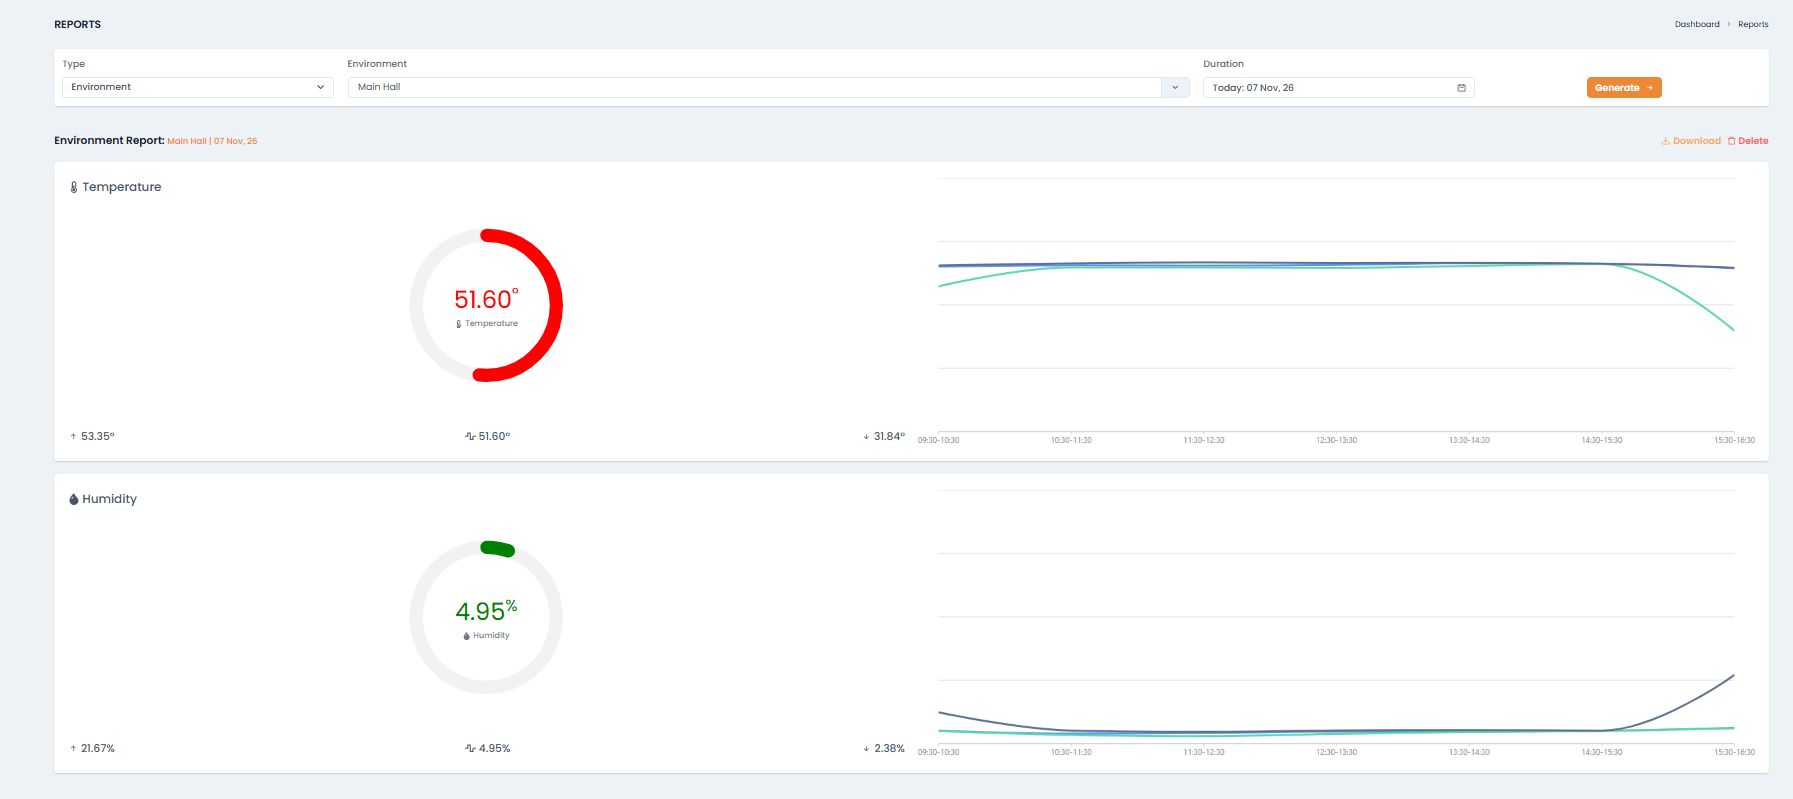
Double Offtimes Detection Algorithm
Industrial PMR includes a specialized diagnostic algorithm for identifying Double Offtimes:Why Double Offtimes Matter
When machine operators face intermittent mechanical or electrical issues (e.g., sticking mold ejector, hopper bridging, or thermal controller trip), they often restart the machine immediately without addressing the underlying root cause. The machine runs for 30–60 seconds before tripping a second time. Industrial PMR identifies these paired micro-stoppages occurring within a short configurable window:- Exposes latent mechanical wear before catastrophic breakdown occurs.
- Identifies operator training opportunities during tool setup.
- Distinguishes between genuine single-incident maintenance stops and chronic intermittent tripping.