
Floor Grid View
The Grid View organizes all production units into visual cards, designed for fast scanning across dense plant floor layouts: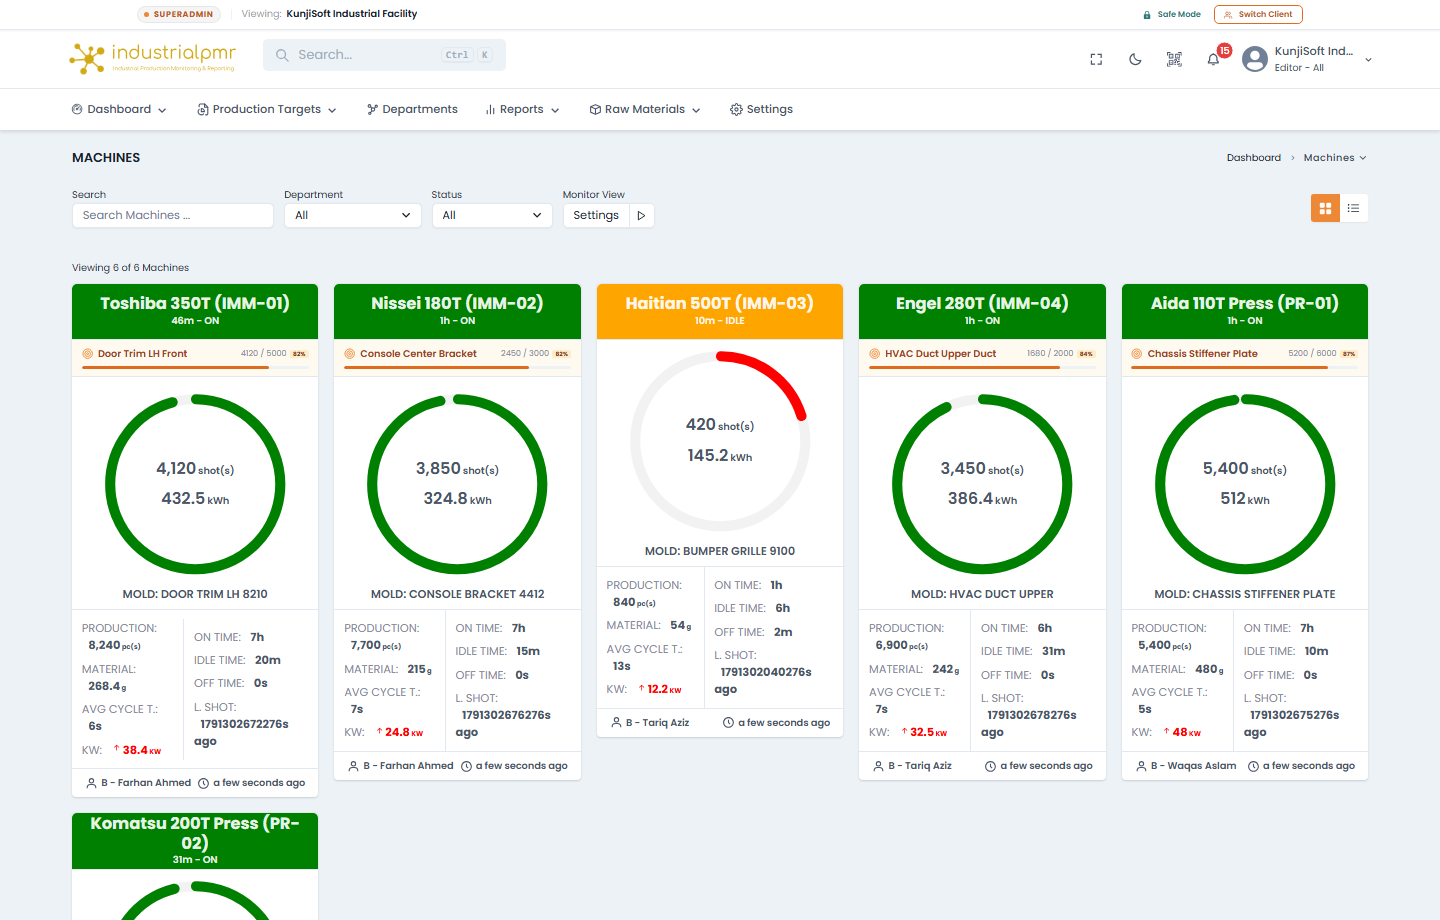
Machine Card Anatomy
Every card provides essential production and electrical parameters at a glance: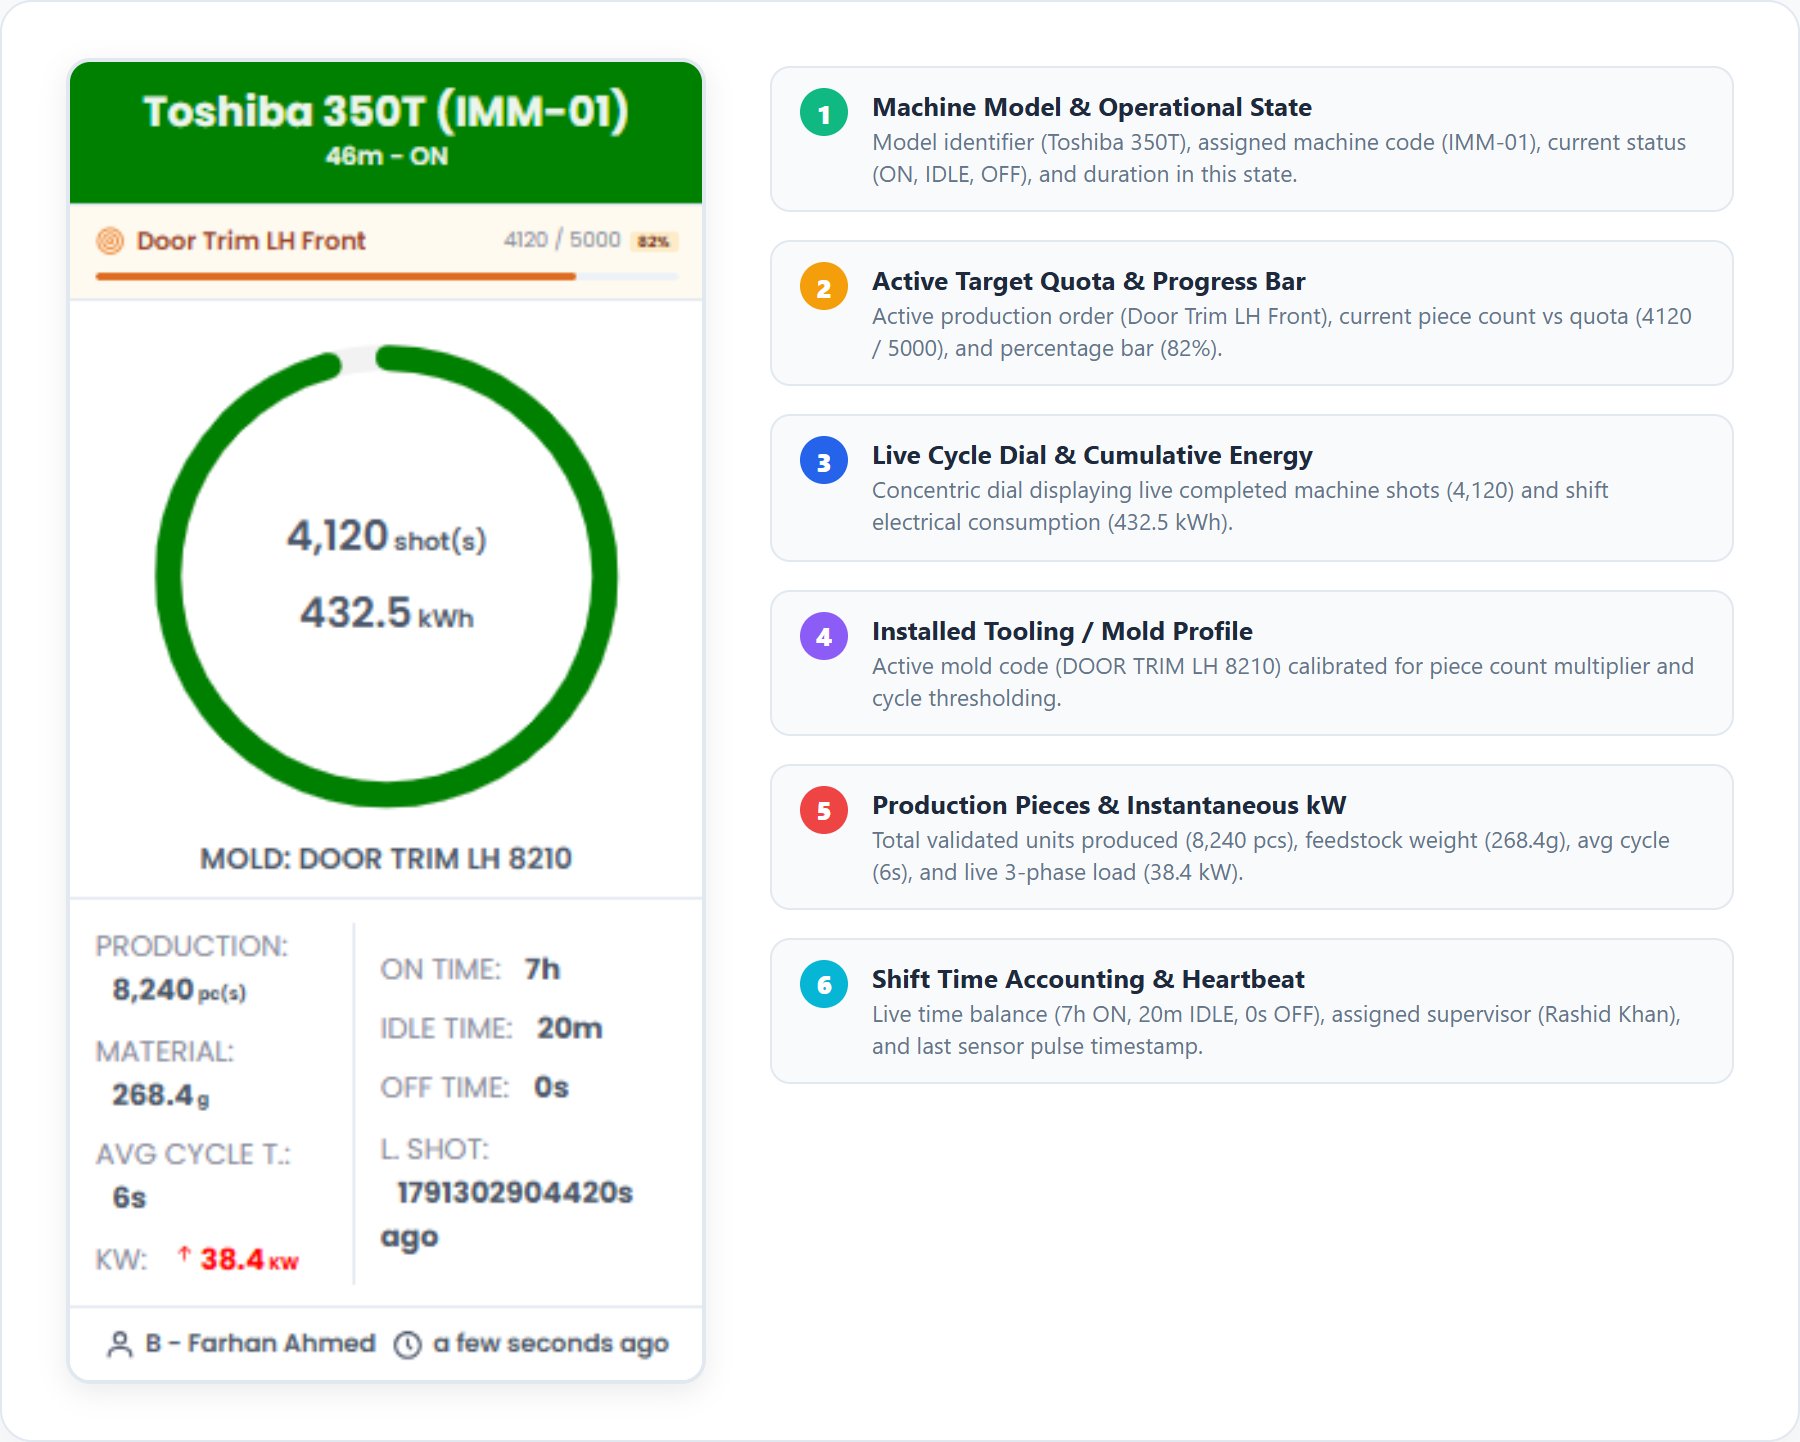
Machine Operational States
The color-coded header banner on each machine card indicates the machine’s real-time state:Search and Filters
The header above the machines includes:Floor List View
For high-density monitoring of facilities with dozens of production machines, toggle to the List View: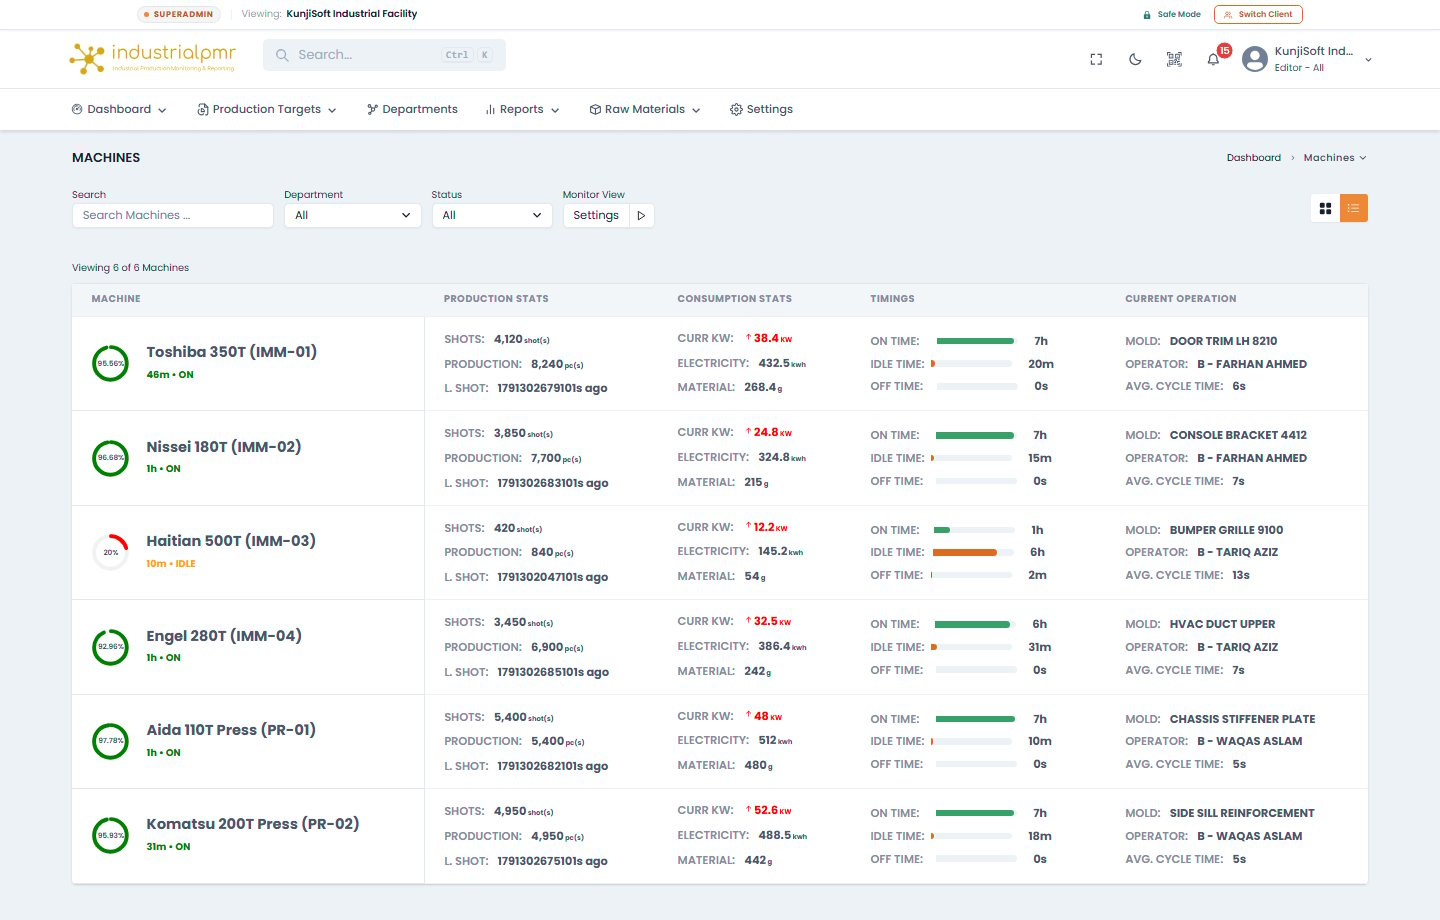
- MACHINE: Machine name, tonnage, and live status (e.g.,
NISSEI 120,TOYO 180,JONWAI,HTL 160 JD,HTL 160 JD (IPMR V2)). - PRODUCTION STATS: Live shots, verified pieces produced, and timestamp of the last recorded cycle pulse.
- CONSUMPTION STATS: Instantaneous active power (
kW), cumulative energy (kWh), and material consumed (gorkg). - TIMINGS: Microsecond-accurate shift run time, idle time, and off time.
- CURRENT OPERATION: Active tool/mold code (e.g.,
GALLON IML 6,BUCKET,PAINT GALLON), shift operator attribution, and average cycle duration in seconds.
Detailed Machine Inspector
Clicking on any machine card opens the dedicated Machine Telemetry Inspector: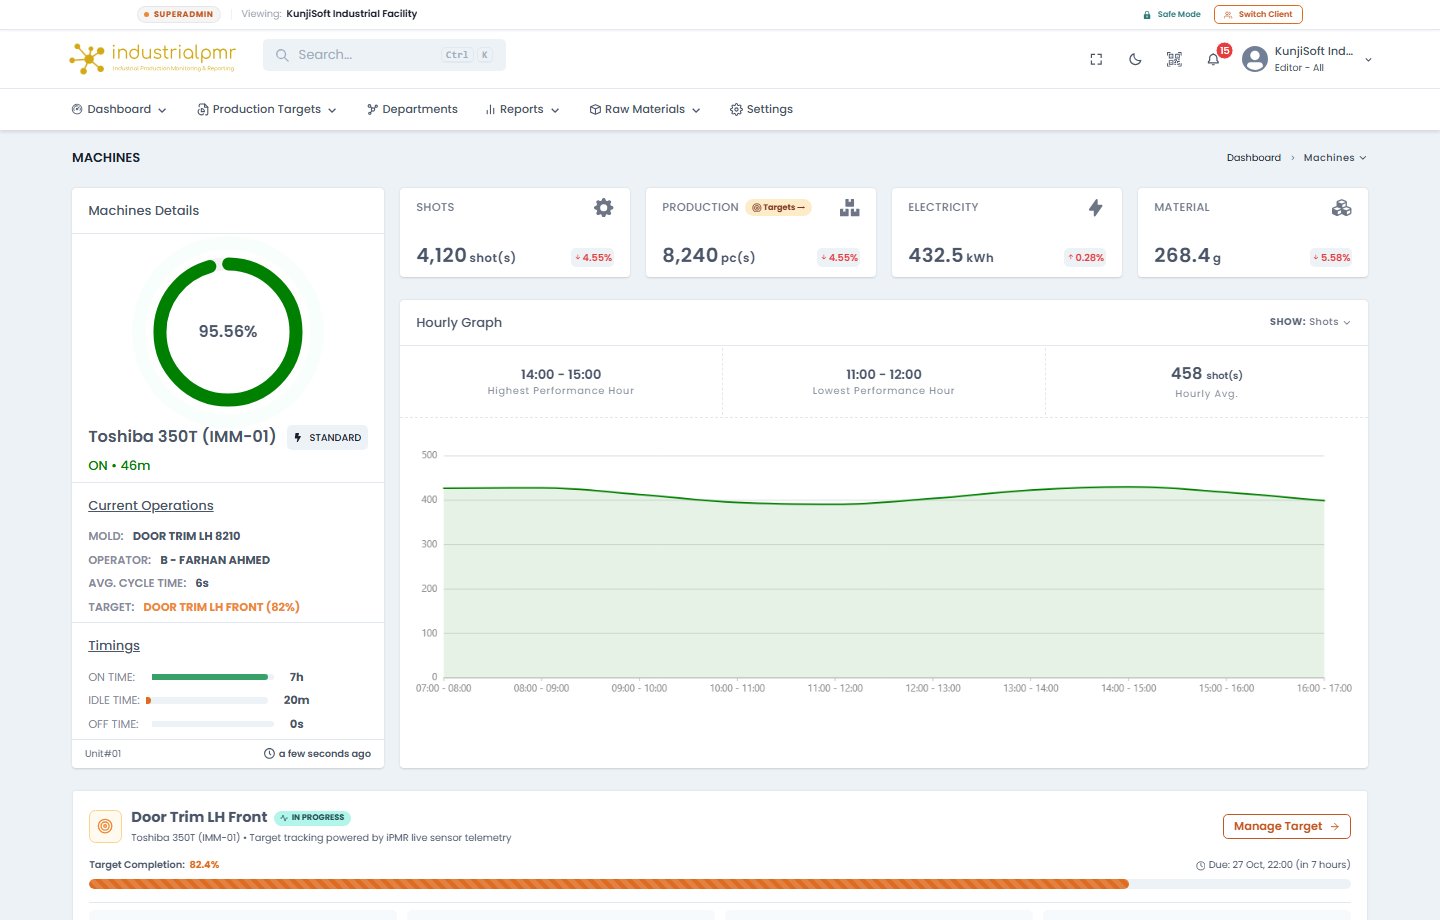
Key Inspector Modules
1. Machine Header & Hardware Node Binding
- Displays machine model, drive type (e.g.,
INVERTERor hydraulic), and hardware node binding (e.g.,Unit#03). - Shows real-time connection status and last synchronization timestamp.
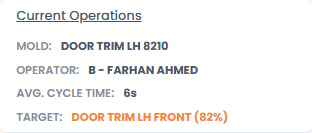
2. Operations & Tooling Profile
- Installed Mold: Active mold identifier with cavity count and theoretical cycle time.
- Operator Attribution: Currently logged-in shift operator.
- Average Cycle Time: Rolling average of the last 10 production cycles compared against mold baseline.
- Target Link: Direct shortcut to assign or review active production orders.
3. Time Accounting Breakdown
Visual horizontal gauges show exact shift balance:- ON TIME: Time spent actively molding or cycling parts.
- IDLE TIME: Time machine spent energized but stationary.
- OFF TIME: Time machine main breaker or motor was powered down.
4. Hourly Performance & Cycle Trends
- Interactive bar charts display shot output and energy demand hour-by-hour across the 24-hour manufacturing day.
- Dropdown filters allow instant switching between Shots, Production Pieces, Energy (kWh), and Material (kg).
Additional Machine Detail Cards
Below the header modules, the machine page includes these cards.The grid/list choice on the Machines page is remembered in the browser. The Equipments list remembers its own choice separately.
Stats & Details
Current status, mold, product, and shift figures. Efficiency excludes planned downtime: idle and off time categorized as Planned are subtracted before the ratio is calculated. See Downtime Categorization.Hourly Details
An expandable tree of shifts, hours, and individual records. Each row shows: Time, Status, Shots, Production, Material, Electricity, On / Idle / Off time, Downtime Reason, average cycle time, Operator, Mold, and Product. The tree exports to CSV. The Downtime Reason column rules are described in Downtime Categorization.Downtime Card
Sits below the hourly details. Review and categorize the machine’s stoppages directly from the machine page. Changes refresh the machine stats.Insights Card
Efficiency ratios that relate energy to output:Material & Mold Breakdown
Material breakdown and Mold breakdown charts. The mold chart has the SHOW selector (shots, production, material, electricity).Production Target Card
Shows the target name, the linked SAP PO number if any, an In Progress or Target Reached status, the completion percentage, and a Manage Target link to the target page.Related Machine Tools
Mold Health & Molds Manager
Track mold life, install and edit molds.
Thermocouple
Live temperature, limits, and alert history.
Machine Power Page
3-phase power analysis at
/machines/:machineID/power.Monitor View (Wallboard Display Mode)
In the Machines header, clicking Monitor View (Settings / Play) launches the specialized shop-floor wallboard mode:
- Auto-Scroll: Automatically scrolls through long lists of machines at a customizable interval (default: 10 seconds).
- Minify Charts: Streamlines card visuals to maximize text legibility on large TV displays viewed from a distance.
- Cycle Status: Automatically cycles filters between
RUNNING,IDLE, andOFFmachines to ensure high visibility for problem units.