
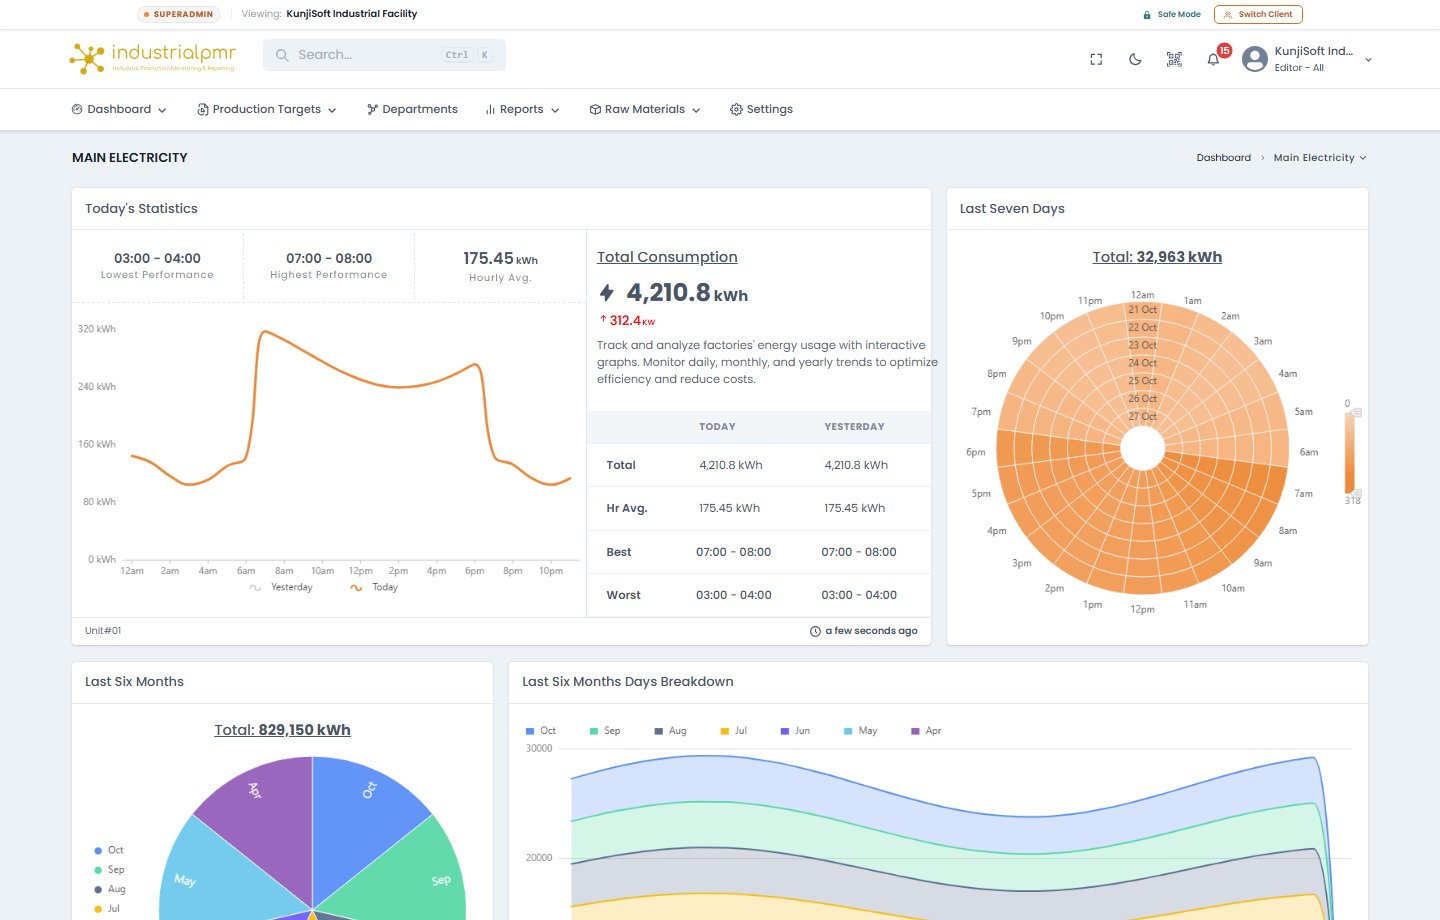
High-Voltage Feeder & Substation Monitoring
Connected directly to 3-phase potential transformers and current transformers via theipmr226 integrated power analyzer node, the electricity engine captures true RMS parameters at sub-second resolution:
Instantaneous Demand (kW)
Live total real power active across the plant, with peak demand thresholds to prevent utility MDI penalties.
Power Factor Compliance
Continuous Power Factor () auditing across all three phases () to prevent utility penalty surcharges.
Cumulative Energy (kWh)
Continuous energy integration, tracked today vs. yesterday and broken down by operational shift.
Dashboard Widgets Explained
1. Today’s Statistics & Hourly Performance
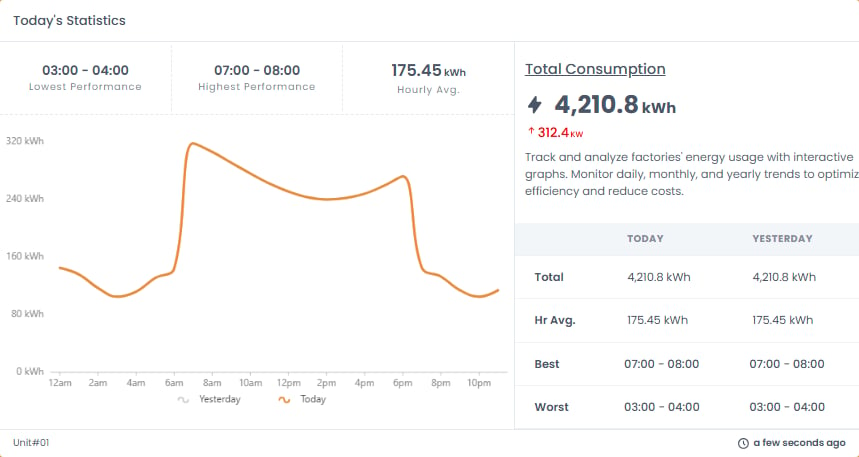
- Highest vs. Lowest Performance Hours: Highlights specific hourly blocks exhibiting abnormal surges or optimal power-to-output ratios (e.g., Lowest 03:00–04:00, Highest 07:00–08:00, Hourly Avg 175.45 kWh).
- Hourly Trend Comparison: Overlays yesterday’s 24-hour demand curve against today’s live curve to detect early energy drift.
2. Total Consumption & Efficiency Table
The central analytics card tracks daily baseline metrics:3. Last Seven Days Radial Polar Chart
On the right side of the screen, a high-density radial heat ring visualizes energy demand across 24 hours of the day over the last seven calendar days: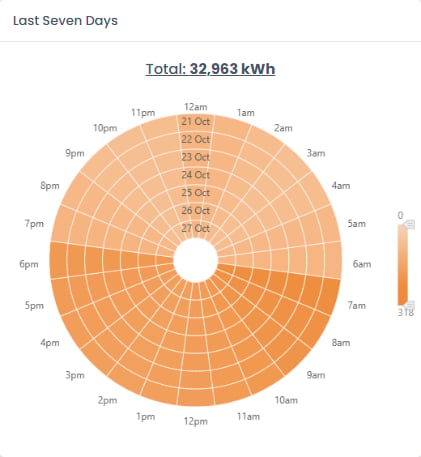
- Concentric Day Rings: Each concentric ring represents a discrete date (e.g., 21 Oct through 27 Oct).
- Radial Hour Axes: The 24 spokes (12am, 3am, 6am, 9am, 12pm, 3pm, 6pm, 9pm) highlight cyclical factory consumption.
- Pattern Recognition: Instantly exposes shift transition spikes, weekend standby loads, and peak-hour utility consumption patterns (Total: 32,963 kWh).
4. Six-Month Longitudinal Trends & Days Breakdown
At the bottom of the screen, long-term historical bars aggregate multi-month consumption:- Monthly Aggregations: Compare total kWh across consecutive months (e.g., May through October) to measure seasonal HVAC and chiller load impacts.
- Daily Dispersion Breakdown: Stacked bar segments illustrate weekday versus weekend energy distributions across each month.
Critical Factory Energy Capabilities
1. Maximum Demand Indicator (MDI) Penalty Shaving
Most industrial utility tariffs charge heavy penal rates if a factory’s instantaneous demand exceeds its sanctioned MDI quota. Industrial PMR computes a rolling 15-minute average demand:- When load reaches 85% of sanctioned MDI, an amber warning triggers on all supervisor dashboards.
- At 92%, automated audio/SMS notifications advise shifting non-critical batch loads (e.g., raw material granulators or auxiliary water pumps).
2. Specific Energy Consumption (SEC)
Energy efficiency is meaningful only when correlated with physical production output: Industrial PMR dynamically divides main meter energy by factory piece output, enabling plant owners to evaluate the true electricity cost embedded in each manufactured part.3. 3-Phase Voltage Balance & Power Quality
Unbalanced 3-phase voltages cause excessive heat buildup and premature failure in induction motors. Industrial PMR monitors Phase voltages:- Phase deviation triggers an automatic power quality warning.
- Low power factor () alerts maintenance teams to inspect capacitor banks and power factor correction (PFC) relays.