
Where You Can Categorize
You can categorize downtime in three places. They all write to the same records, so a change in one shows up in the others.Categorizations made on a target are saved to the machine’s downtime reasons too, so they also appear in the Machine report and the Factory report. Earlier values are kept in the history.
Who Can Categorize
Categorizing downtime requires the account owner, an Editor, or a master admin. Anyone else receives Permission Denied (“You do not have permission to categorize downtime”).The Categorize Downtime Dialog
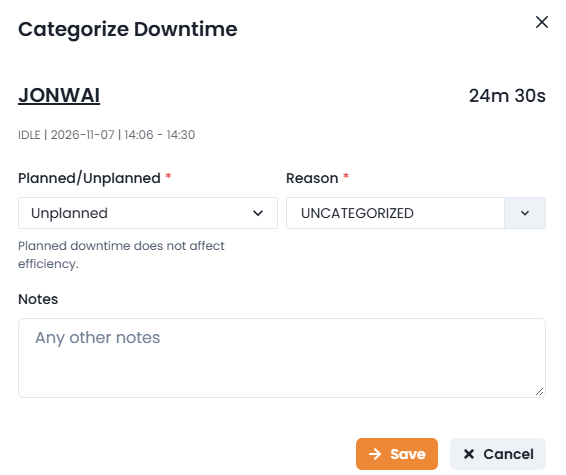
- Choose Planned or Unplanned.
- Choose a reason.
- Add a note (optional).
- Planned: Excluded from efficiency loss
- Unplanned: Counts against efficiency
Reasons
- uncategorized
- machine problem
- machine maintenance
- material
- mold change
- part change
- other
Bulk Categorization
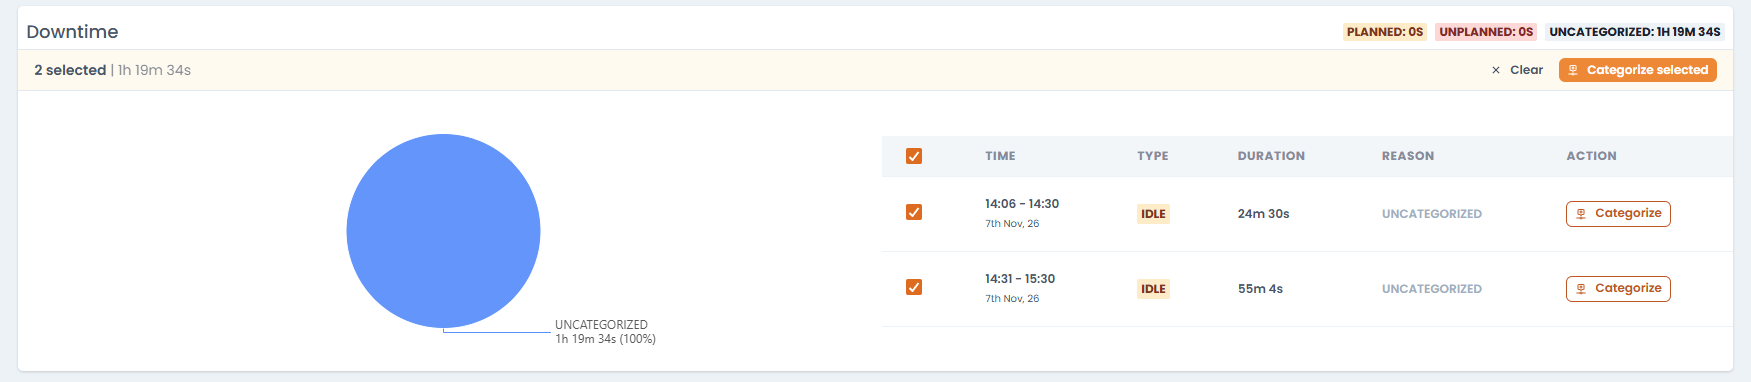
- A header checkbox selects every uncategorized row.
- While rows are selected, the bar shows the count, the total duration, Select all uncategorized (n), Clear, and Categorize selected.
- Rows that are already categorized (the button reads Edit) can be updated. In bulk mode, the dialog warns how many selected rows will be overwritten.
Downtime Card and Downtime Sections
The machine page Downtime card, the Production Target report downtime section, and the Machine report downtime section share the same layout and behavior.Machine Page: Downtime Monitoring Card

- Category Distribution shows each category’s share of the total.
- Hourly Stoppage Chunks & Reasons lists the stoppages hour by hour. A stoppage that is still going shows a red ACTIVE badge.
- If nothing stopped, the card shows Zero Stoppages Recorded Today.
Production Target Report: Downtime Section
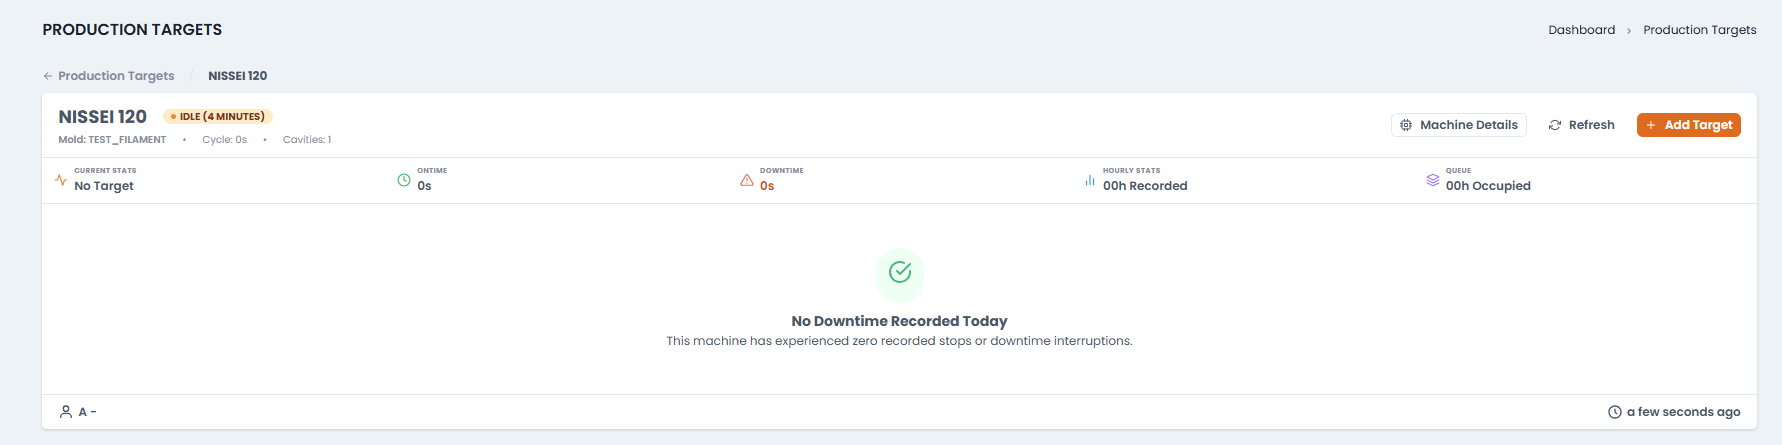
Selecting Several Stops
In the stoppage tables, tick rows to categorize several at once. Shift + click selects a range of rows. The header checkbox selects every uncategorized row, and Clear deselects all.Machine Report Date Range Limit
In a Machine report, idle and off time can be categorized for ranges of up to 31 days. For a longer range the section shows Date range too long and lists categorized downtime only. Select 31 days or fewer to categorize more. If there is no idle or off time in the report, it shows No Downtime Found.How Downtime Appears
Hourly details (machine page and single-day Machine report)
The Downtime Reason column follows these rules:- A row has downtime when it has any off time, or at least 60 seconds of idle time. Rows without downtime show
-. - The category is shown in capitals, with a Planned badge for planned stops and the note underneath (truncated, full text on hover).
- Downtime with no category shows in red as UNCATEGORIZED.
- If a row overlaps several categories, all of them are listed.
- The CSV export includes the Downtime Reason column. Rows are labelled Shift, Hour, or Detail according to their level in the tree.
Target Downtime tab
Lists every stop with Started, Reason, and Duration.- Stops that began before the target started are ignored.
- A stop left open when the machine resumed is closed automatically.
- Duplicate records are merged.
The categorization prompt appears when the machine is not running, the target has started, Monitor Downtime is on, and downtime records exist.
Machine report downtime section
- A pie chart of downtime by category and a table with Time, Type, Duration, Reason, and Action.
- The summary splits downtime into Planned, Unplanned, and Uncategorized.
- Stops from the target Downtime tab appear here, and categorizing them here updates the target’s records too.
- Stops after midnight but before the first shift starts are shown under the following calendar date.
- A saved entry with no matching live stop appears only if it falls within the report’s date range.
Effect on Efficiency and OEE
Planned downtime is excluded from efficiency loss. It is applied in these places:
The target Current Stats tab shows a Planned badge next to the downtime figure, with the total planned downtime, whenever there is any.