
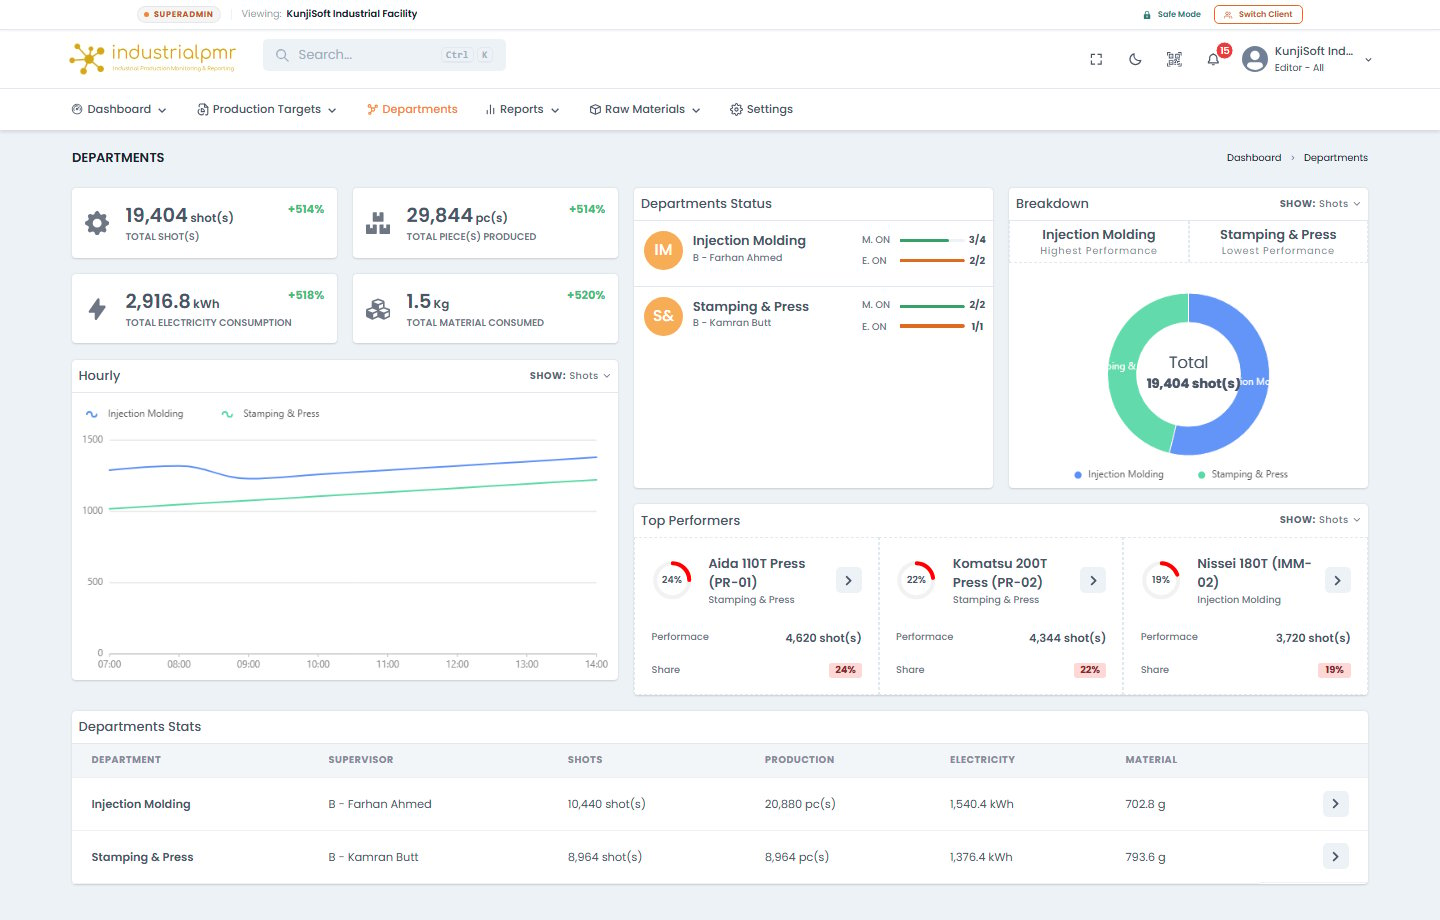
Departmental Topology
Industrial facilities are modeled hierarchically, allowing multi-tier rollups from individual sensors up to corporate multi-plant overviews:Departmental Performance Metrics
On the Departments screen, aggregated key performance indicators provide instant cross-line comparisons:Total Shots
Cumulative stroke count across all machines assigned to the department.
Total Pieces Produced
Sum of accepted output pieces produced across the department’s active tooling.
Total Electricity
Aggregated energy consumption (kWh) across all machines and feeder circuits in the department.
Total Material Consumed
Combined resin/feedstock consumed across all departmental production lines.
Operational Widgets on the Departments View
1. Line Performance Breakdown
Compares productivity across departments:- Highest Performance: Automatically highlights the department achieving the highest quota completion percentage during the active shift.
- Lowest Performance: Identifies production lines experiencing bottleneck stoppages, material starvation, or extended mold changeover.
2. Top Performers Matrix
Ranks operators and machines within the department based on:- OEE Scoring: Combined Availability, Speed, and Quality ratings.
- Cycle Consistency: Low cycle-time standard deviation indicating continuous, rhythm-stable operation.
3. Hourly Departmental Output
Tracks hour-by-hour production piece rates across the full 24-hour manufacturing day, allowing managers to spot mid-shift slumps or lunch break transition delays.Auxiliary Equipment Tracking
Beyond primary molding and stamping machines, plant efficiency depends heavily on uninterrupted auxiliary utility equipment:Auxiliary equipments are configured in Settings > Equipments with rated kW ratings and hardware current sensor bindings to accurately reflect plant base-load energy consumption.
Departments Page
The Departments page shows total stats, top performers, a department breakdown, an hourly chart, and the department list.Department Detail
Selecting a department opens its detail page:- Overview: name, production status, supervisor, machines ON, and equipments ON.
- Hourly chart and hourly spider chart.
- Machines table: Machine, Status, Shots, Production, Material, Electricity, and Mold, with a breakdown pie.
- Equipments table: Equipment, Status, and Electricity, with a breakdown pie.
Equipments Page
- Grid or list layout. The choice is remembered in the browser, separately from the Machines page.
- The list shows Equipment, Current Operation, and Consumption Stats.
Equipment Detail
- A selector to switch between equipment without leaving the page.
- Details with current operations (sessions and on time).
- An hourly card with chart.