
/machines/:machineID/power. It gives engineers a full electrical picture of a single machine, separate from the plant-wide Main Electricity view.
The page has four tabs.
A status line at the top shows the connection state: Connecting to device…, Restoring connection…, Device connected, or Device offline.
Live streaming is started through a REST subscription that is renewed every 15 seconds while the page is open.
Real-Time Monitoring
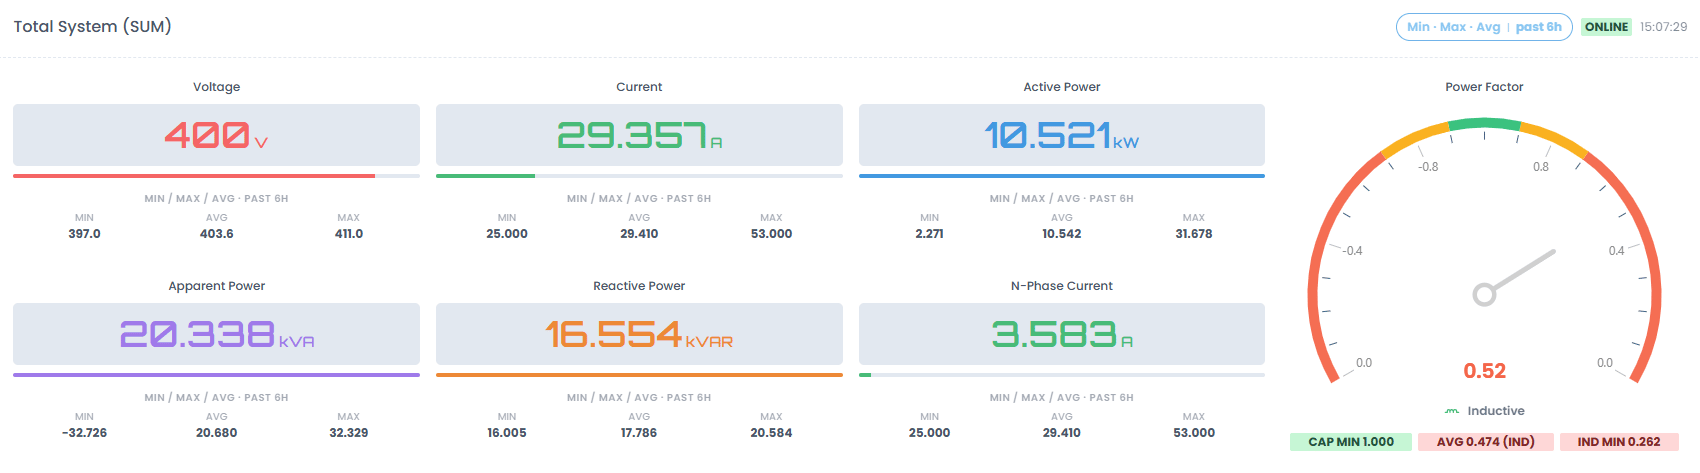
- Voltage and current
- Active, apparent, and reactive power
- Power factor and frequency
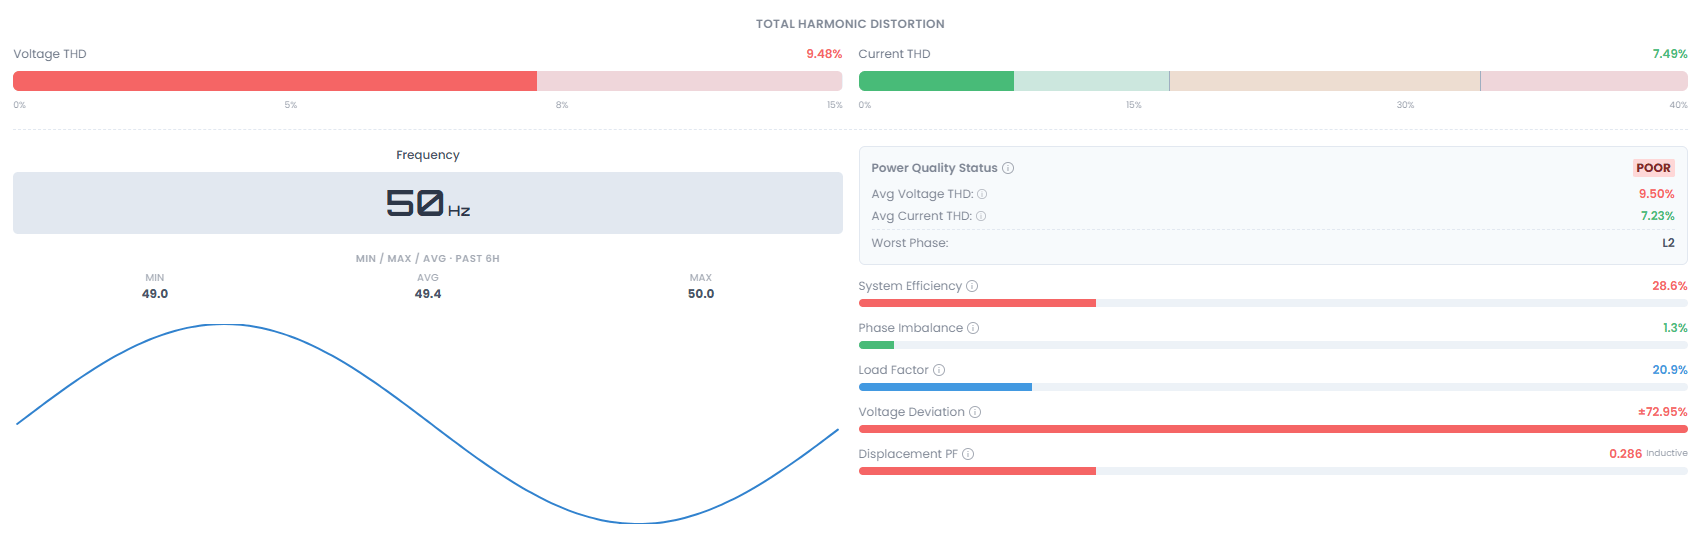
- Voltage THD and current THD bars
- A power-factor gauge
- A live frequency chart
THD Color Bands
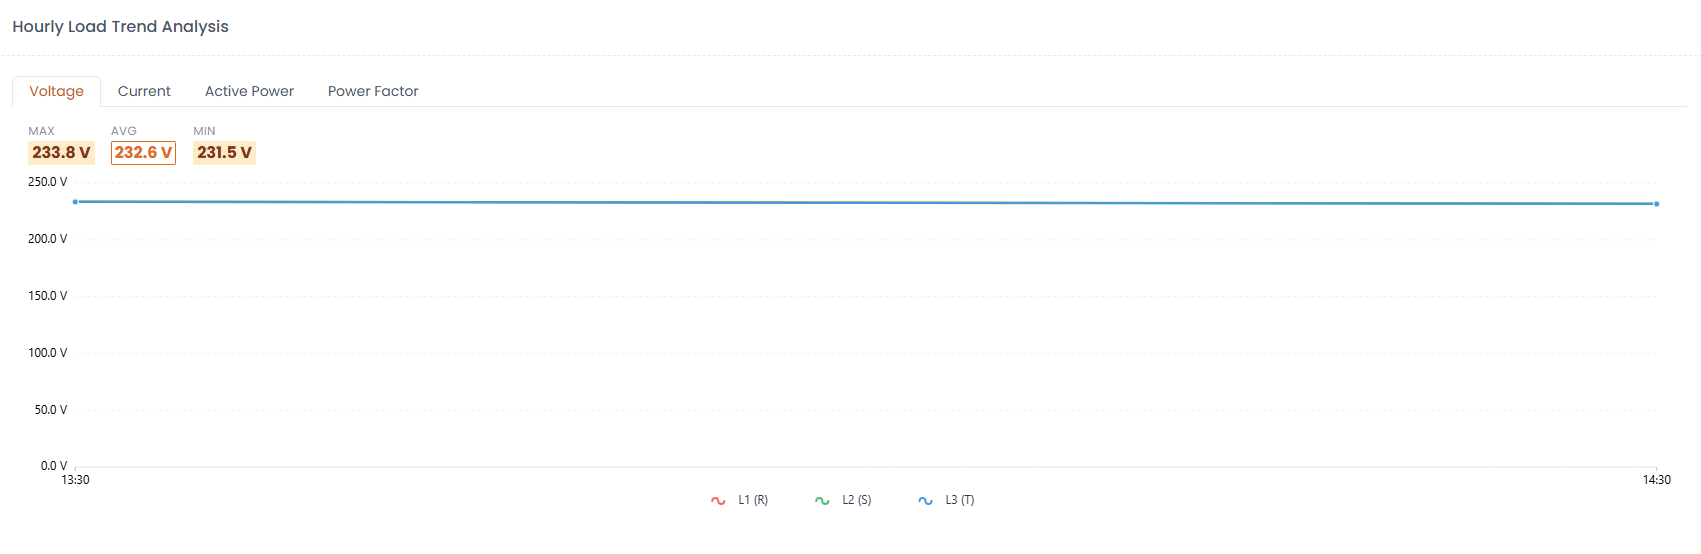
Trend Analysis
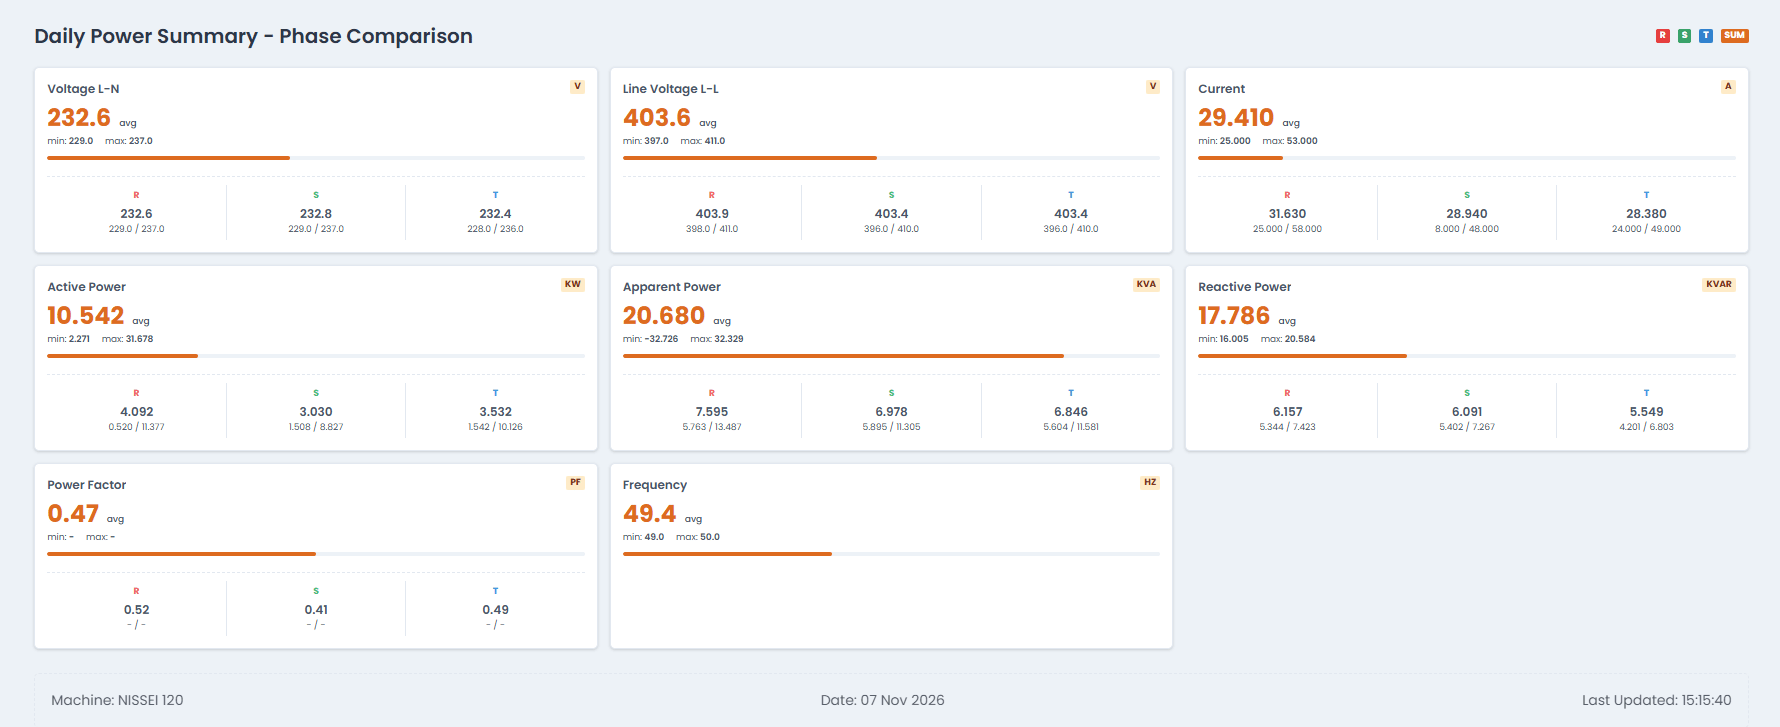
Data Grid
Accumulators

- Active energy: import, export, total
- Reactive energy: inductive, capacitive, total
- Apparent energy
Per-Machine Alert Thresholds
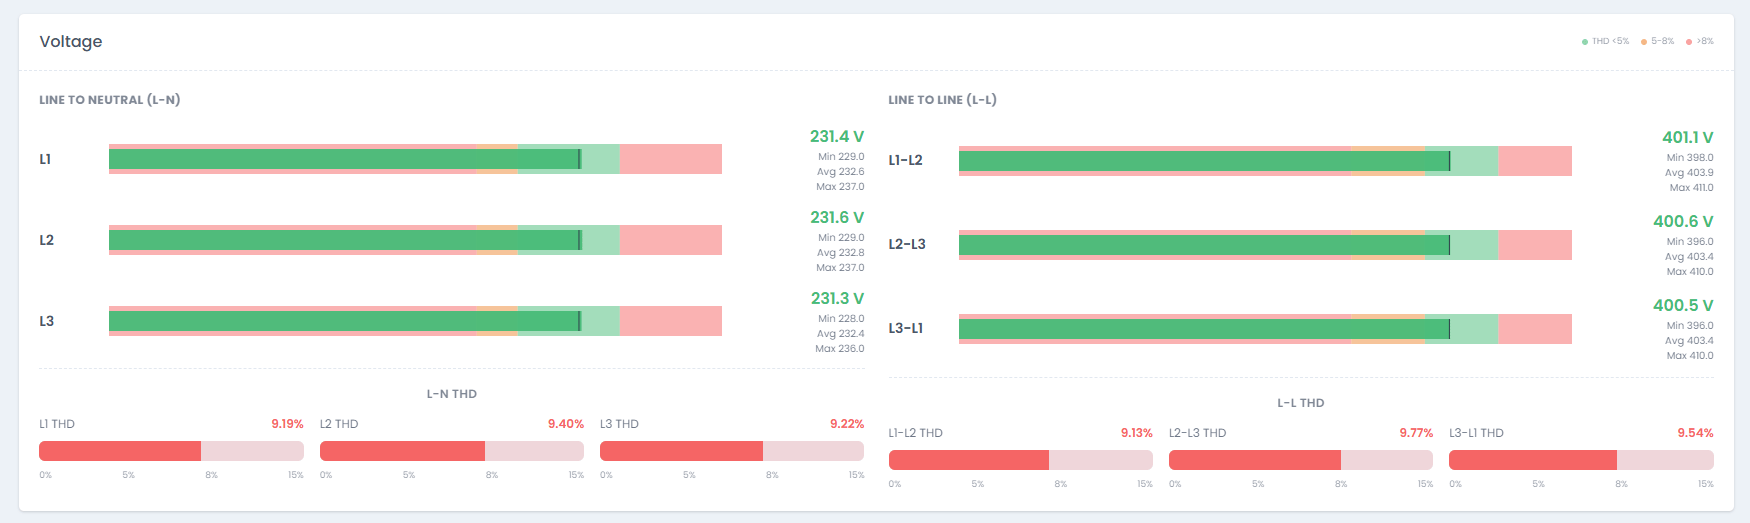
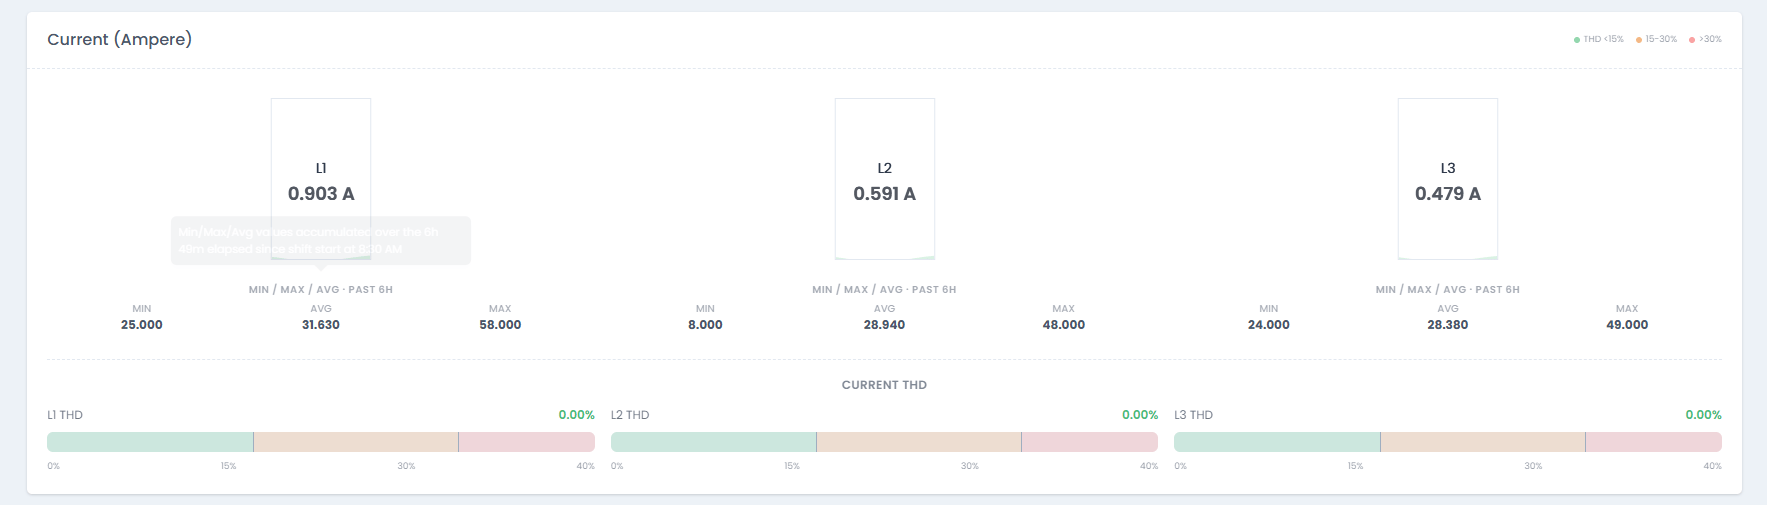
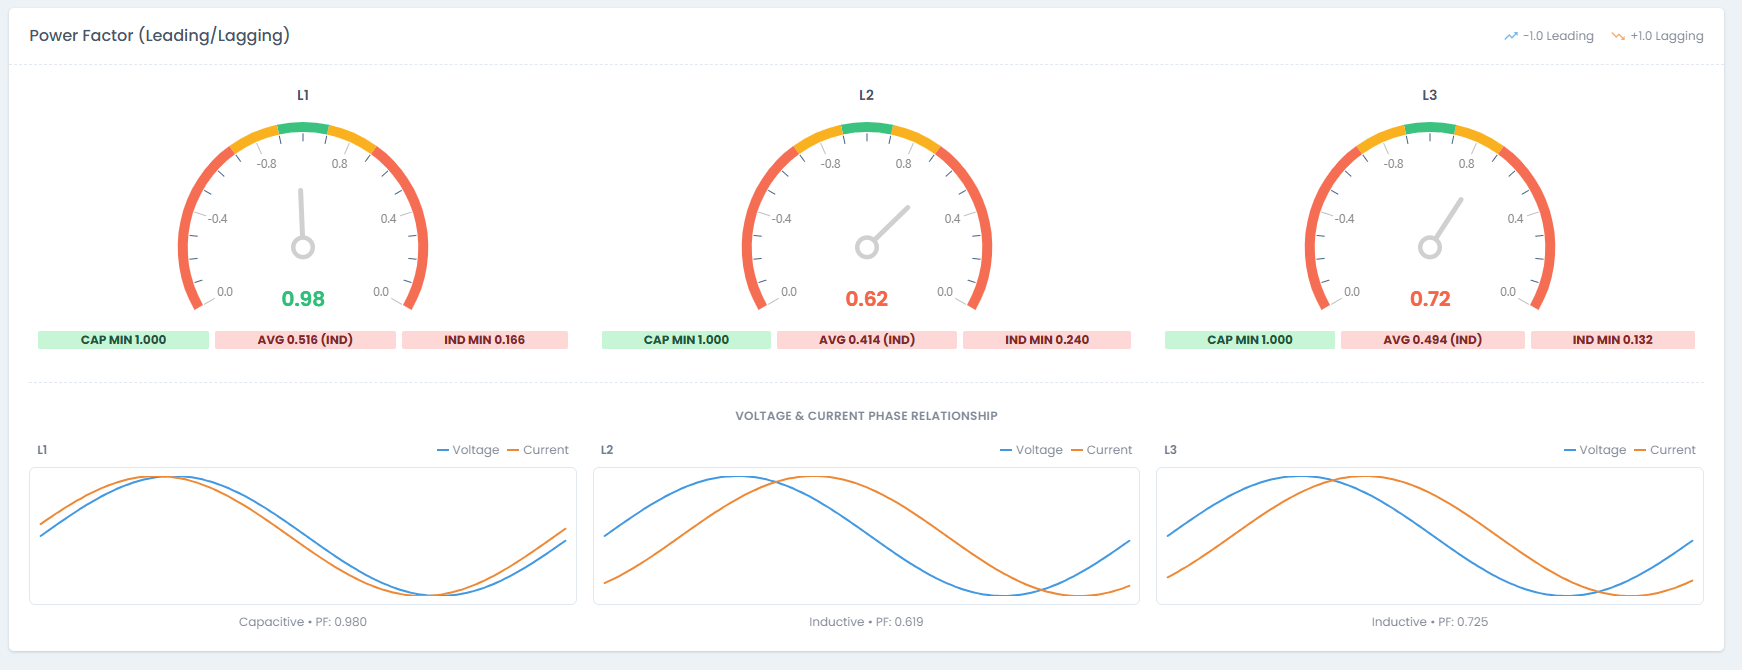
- Voltage L-N and Voltage L-L
- Current L1, L2, and L3
- Power Factor
- Voltage THD and Current THD
Templates
Choose a template, then adjust any value:- Voltage and power-factor limits are critical severity.
- THD limits are warning severity.
- Current limits have no default and are set per machine capacity.
Hysteresis
Hysteresis prevents alerts from flickering on and off. After a limit is breached, the value must recover past the limit by the hysteresis percentage before the alert clears.Alert History
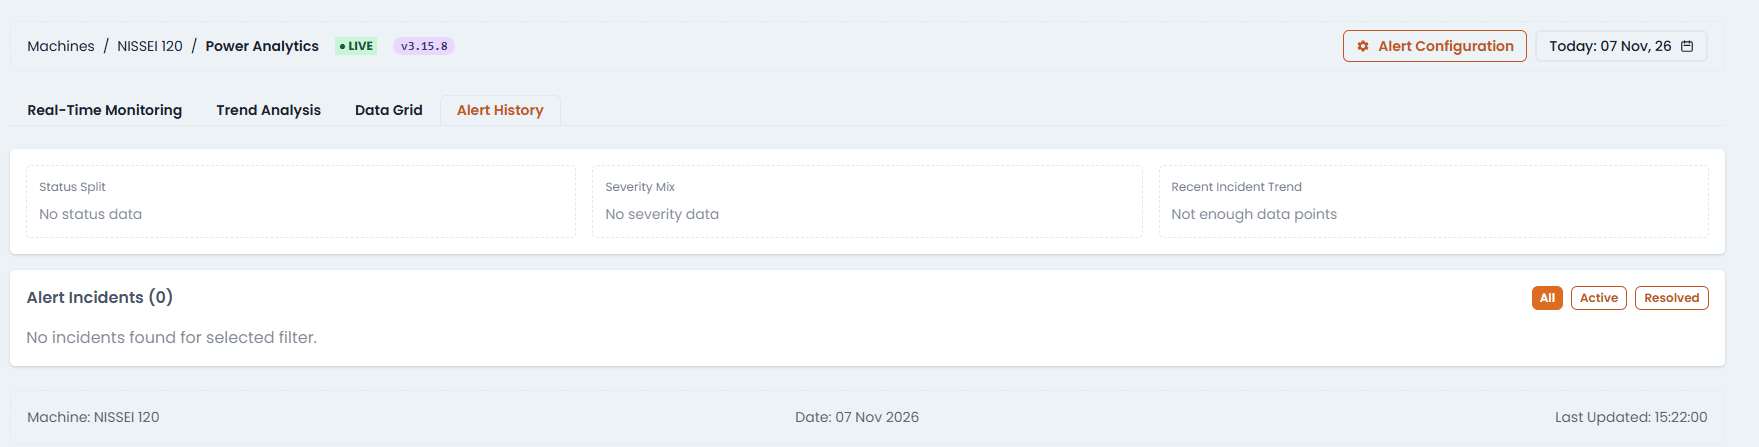
- Parameter and phase
- Limit, actual value, and peak value
- Severity
- Start, end, and duration