
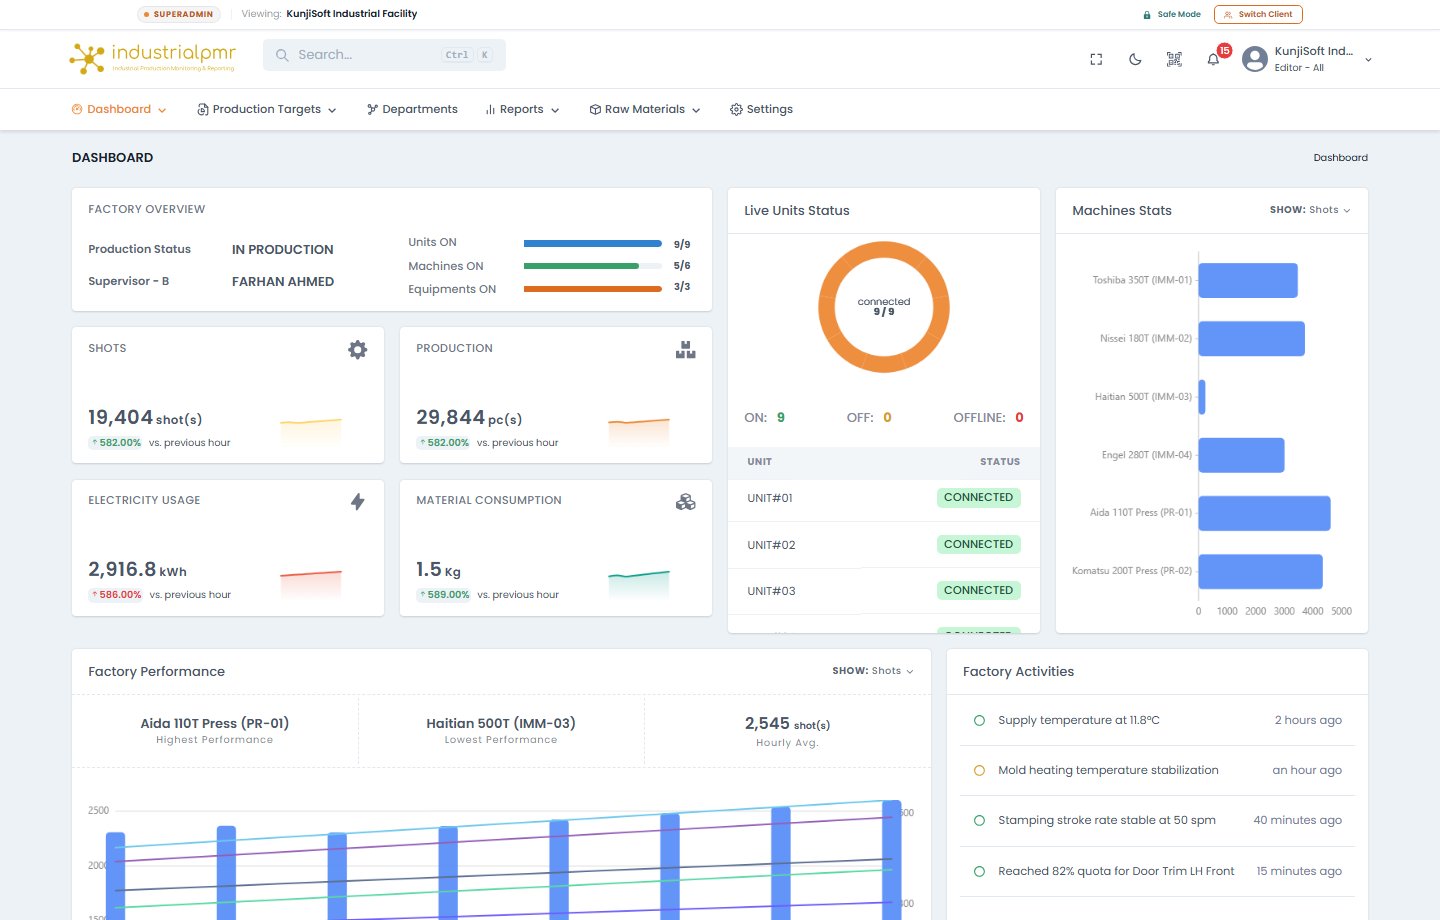
Master KPI Summary Cards
The top section aggregates plant floor production and energy usage across the entire factory for the current active shift:Total Shots / Strokes
Cumulative machine cycles recorded across all connected injection molding, stamping, and tufting machines.
Production (Pieces / Meters)
Total verified pieces produced, dynamically calculated based on mold cavity counts and production multipliers.
Electricity Usage (kWh)
Cumulative kilowatt-hour consumption measured at machine sub-panels and the main factory incomer.
Raw Material Consumed (g / kg)
Total resin or feedstock consumed, computed from part shot weight and runner scrap parameters.
Live Units Status & Fleet Health
Located on the upper right of the dashboard, the Live Units Status widget provides real-time visibility into the physical edge IoT gateway infrastructure:Edge State Classifications
Each unit also shows how far behind its data is and its MAC address when known.
How long a unit can be out of contact before it is shown as OFFLINE is set per factory in Settings > General (3, 10, 15, or 20 minutes). See Efficiency Method and Offline Time.
Stats Card, Charts & Tables
Everything below applies to the factory currently selected in the factory selector.
- Stats card: production status, supervisor, and the Units, Machines, and Equipments ON counts (for example
5/8). - Hourly chart: hour-by-hour totals for the whole factory, with the best and worst hour called out.
- Machines graph, machines spider chart, and equipments spider chart: compare units side by side.
- SHOW selector: each chart can switch between shots, production, material, and electricity. Meter-based factories show production in meters and hide shots.
Factory Activities Feed
Located in the bottom-right panel, the Factory Activities feed logs recent machine and equipment status changes. Hover over an entry to see the exact time:- Operational Condition Events:
Supply temperature at 11.8°C(Auxiliary chiller water feed verified).Mold heating temperature stabilization(Zone thermal equilibrium attained).Stamping stroke rate stable at 50 spm(Continuous stroke consistency achieved).Reached 82% quota for Door Trim LH Front(Proactive milestone notification before job order completion).
Header Controls & Productivity Utilities
The top global navigation bar includes quick utilities engineered for factory supervisors:- Global Search (
Ctrl + K): Instantly find a page, machine, equipment, or environment by name. See Global Search. - Full-Screen Wallboard Mode (
[ ]): Toggles browser borderless full-screen display for dedicated TV screens mounted on shop-floor control towers. - Dark / Light Mode Toggle: Switches between high-contrast daytime viewing and eye-friendly dark mode for evening and night shifts.
- QR Code Floor Scanner: Quickly scan an edge node QR code via a mobile tablet camera to navigate directly to that machine’s live inspector.
- Notification Bell with Alert Badge: Displays unacknowledged threshold alarms (e.g., phase current imbalance, prolonged idle time).
- Multi-Plant / User Profile Switcher: Switch active manufacturing facilities (for organizations with multi-plant deployments) and manage user account settings.
- Get the App: A QR button opens a modal with a QR code and Google Play / App Store links. See Login, Roles & Navigation.
For sign-in, roles, breadcrumbs, and the notification bell, see Login, Roles & Navigation.